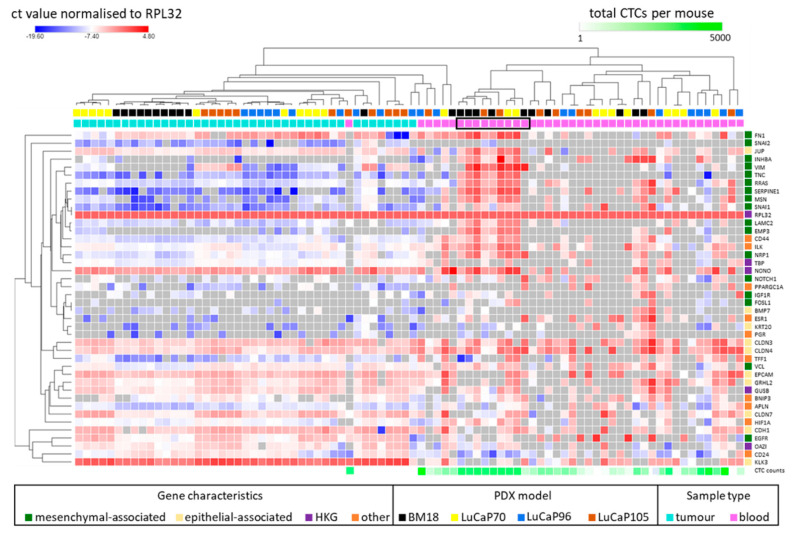
Figure 5.
Heat map showing 42 gene panel expression profiles in blood and matched tumour samples as Ct values normalised to RPL32, with global normalisation. Hierarchical unsupervised clustering was performed using one minus Pearson correlation. For each sample, the PDX model is shown above the heat map, followed by colour coding to indicate tumour (teal) and blood (pink) biospecimens. The final row indicates estimated circulating tumour cell (CTC) counts for each blood sample. Black block indicates cluster of blood samples showing evidence of a hybrid phenotype. Genes are categorised as mesenchymal-associated, epithelial-associated, potential HKG (GUSB, TBP, OAZ1 and NONO), and others (which includes HR- (ESR1, PGR and TFF1), CSC- (CD24 and CD44), hypoxia- (APLN, HIF1A and BNIP3), metabolism- (PPARGCIA), and anoikis- (ILK) associated genes). HR, hormone receptor; CSC, cancer stem cell; HKG, housekeeper gene.

