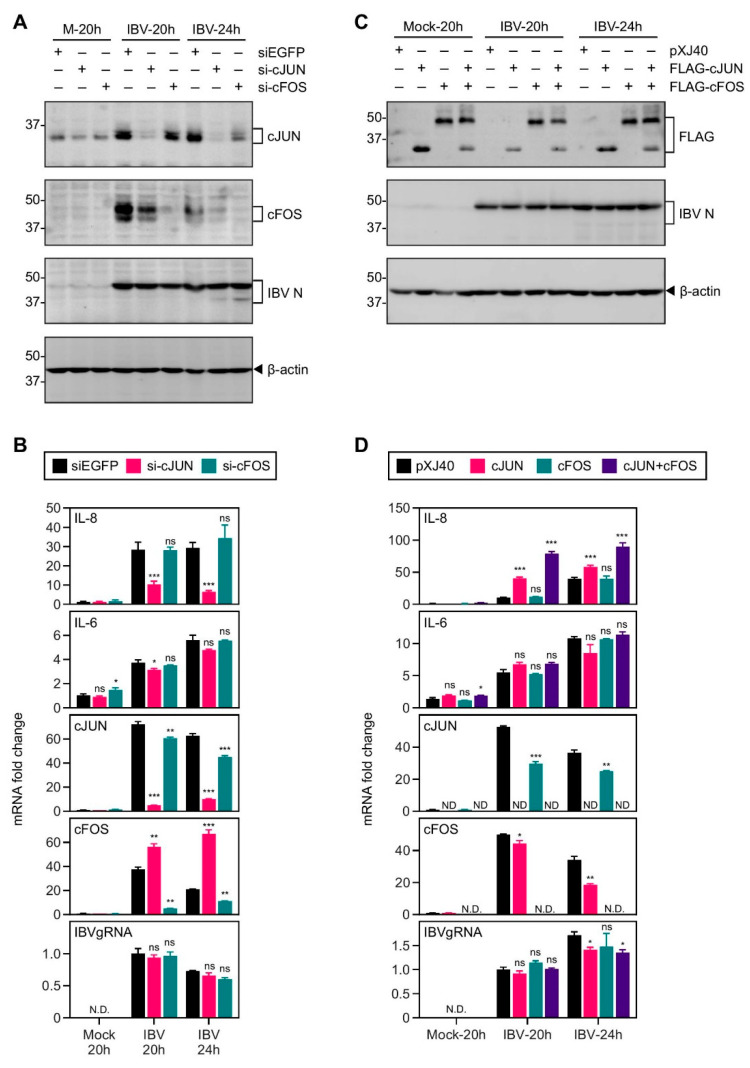
Figure 5.
cJUN and cFOS synergistically induced IL-8 mRNA expression in cells infected with IBV. (A) H1299 cells were transfected with siEGFP, si-cJUN, or si-cFOS, before being infected with IBV at MOI~2 or mock infected (M). Cell were harvested at the indicated time points and subjected to Western blot analysis using the indicated antibodies. Beta-actin was included as the loading control. Sizes of protein ladders in kDa are indicated on the left. (B) Total RNA samples were extracted from cells in (A) and subjected to RT-qPCR. The levels of IL-8, IL-6,cJUN, cFOS, and IBV genomic RNA were determined by the ΔΔCt method using the GAPDH mRNA of the siEGFP-transfected, 20 h post mock-infected sample for normalization. The experiment was repeated three times with similar results, and the result of one representative experiment is shown. Significance levels were presented by the p-value (ns, non-significant; *, p < 0.05; **, p < 0.01; ***, p < 0.001; N.D., non-determined). (C) H1299 cells were transfected with pXJ40, pXJ40-FLAG-cJUN, pXJ40-FLAG-cFOS, or an equal molar mixture of pXJ40-FLAG-cJUN and pXJ40-FLAG-cFOS, before being infected with IBV at MOI~2 or mock infected (M). Cells were harvested and Western blot analysis using the indicated antibodies. Beta-actin was included as the loading control. Sizes of protein ladders in kDa are indicated on the left. (D) Cell lysates in (C) were subjected to RT-qPCR as in (B). The levels of IL-8, IL-6, cJUN, cFOS, and IBV genomic RNA were determined by the ΔΔCt method using the GAPDH mRNA of the pXJ40-transfected, 20 h post mock-infected sample for normalization. The experiment was repeated three times with similar results, and the result of one representative experiment is shown. Significance levels were presented by the p-value (ns, non-significant; *, p < 0.05; **, p < 0.01; ***, p < 0.001; N.D., non-determined).

