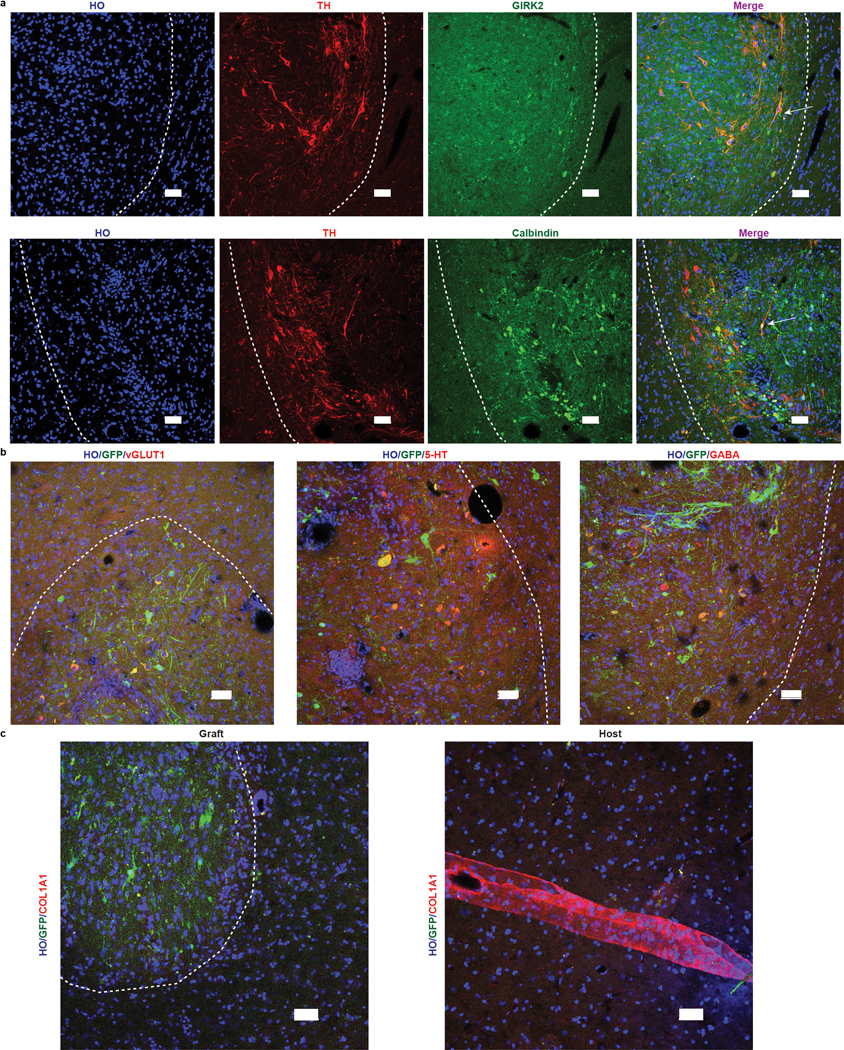
Extended Data Fig. 7. Cellular composition in grafts.

a, Representative images of TH and GIRK2 or Calbindin immunostaining in grafts. Scale bars: 50 μm. b, Representative images of vGLUT1, 5-HT and GABA immunostaining in grafts. Scale bars: 50 μm. c, Representative images of COL1A1 immunostaining in and outside of grafts. scale bars: 50 μm. The white dash lines mark the edge of the graft. All grafts (if present) in monkeys from both groups were examined. Data are representative of at least 3 sections having grafts from each monkey (a-c).
