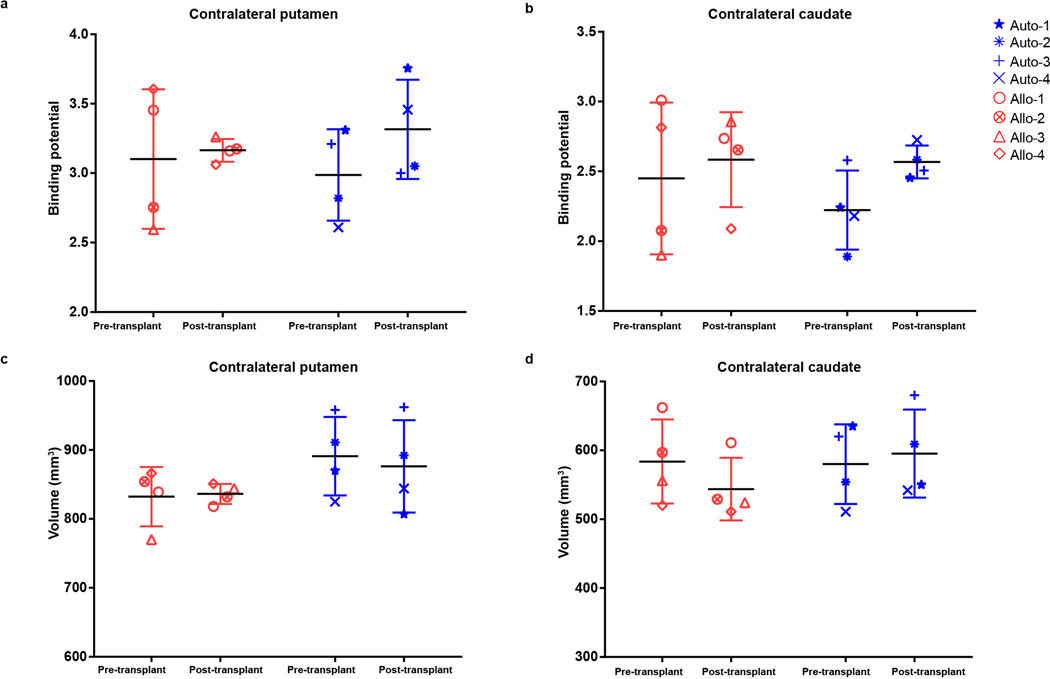
Extended Data Fig. 3. Graft evaluation in vivo.
a,b, Quantification of [11C]DTBZ graft binding potential in contralateral (untreated) putamen (a) and caudate (b) from allogenic and autologous monkeys before and after transplantation. The data is presented as mean ± SD (n=4 per group). c,d, Quantification of the volume of uptake in contralateral (untreated) putamen (c) and contralateral caudate (d) from allogenic and autologous monkeys before and after transplantation. The data is presented as mean ± SD (n=4 per group).

