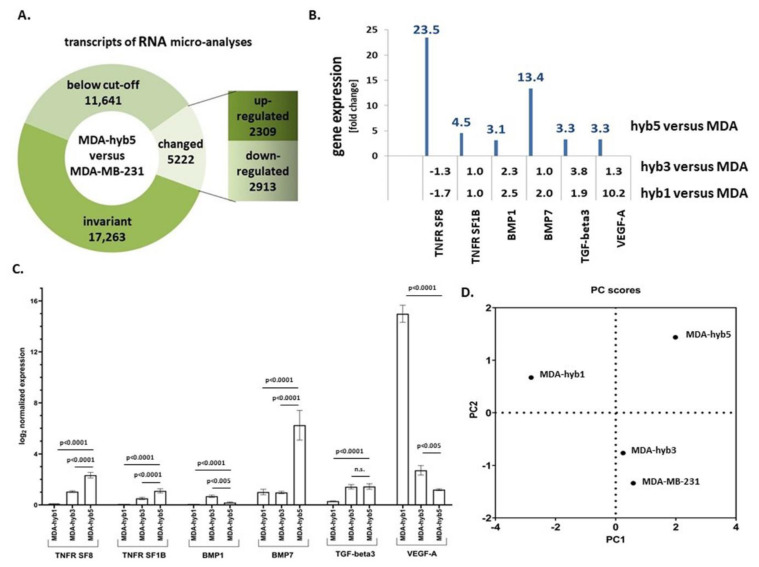
Figure 5.
(A) RNA microarray analysis of 34,126 transcripts was performed in MDA-hyb5 cells as compared to the parental MDA-MB-231 cells. Changes in transcript levels below 2-fold were considered below cut-off. (B) Analysis of the RNA microarray data was performed with a focus on the expression of dormancy-associated genes (tumor necrosis factor receptor superfamily member 8 (TNFR SF8); tumor necrosis factor receptor superfamily member 1B (TNFR SF1B); bone morphogenic protein1 (BMP1); bone morphogenic protein7 (BMP7); transforming growth factor-beta3 (TGF-beta3); vascular endothelial growth factor-A (VEGF-A)). Differences in fold changes are indicated for the relationship of gene expression in MDA-MSC-hyb5 (hyb5), MDA-MSC-hyb3 (hyb3), and MDA-MSC-hyb1 (hyb1) cells versus the parental MDA-MB-231 (MDA) cells, respectively. (C) Gene expression levels were normalized to GAPDH and RPL13A by qPCR. Data represents the mean + SEM of the corrected expression levels (n = 4) and significance (p) was calculated by the Dunnett’s multiple comparison ANOVA test (ns = not significant). (D) A scattered plot of principal components (PC) was generated by GraphPad Prism v9.00 and demonstrated the differences between the cell lines according to the genes analyzed.

