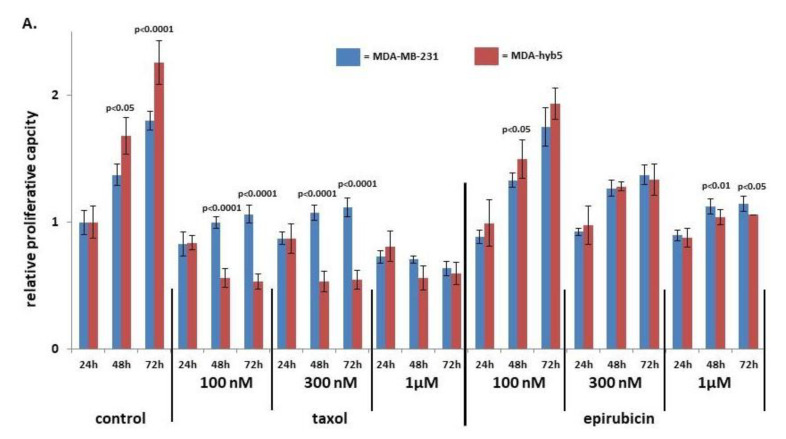
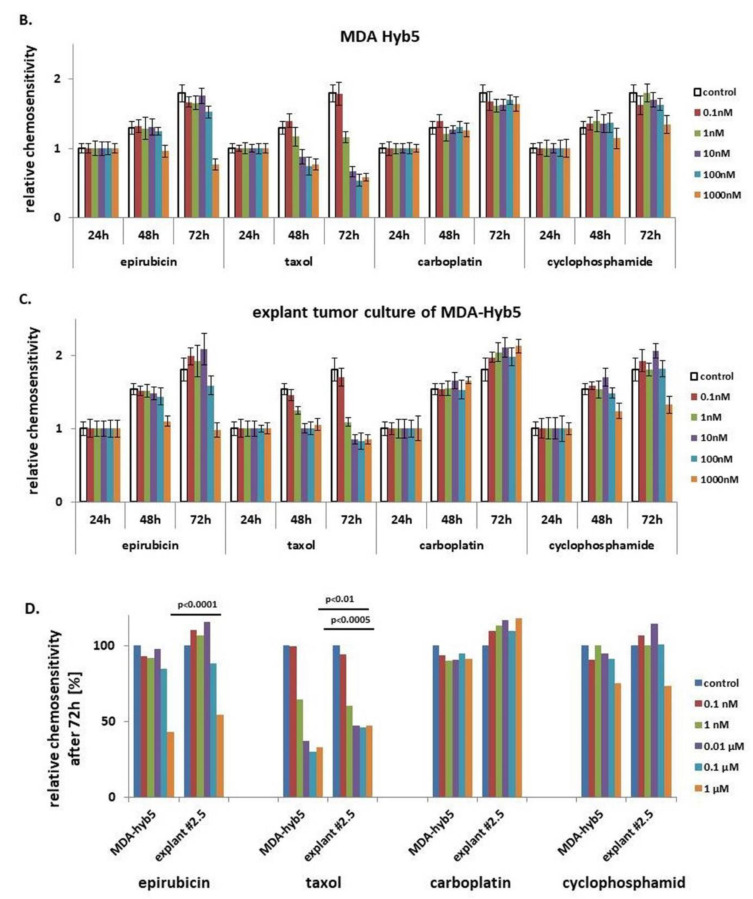
Figure 7.
(A) MDA-MB-231 and MDA-hyb5 cells were treated with the indicated concentrations of taxol and epirubicin for 24 h to 72 h, respectively. Thereafter, the cells were lyzed and measured by fluoroscan assay. The data were normalized to the 24 h control cells. The relative data represent the mean ± s.d. of three independent experiments with three replicates each. Significance (p) was calculated by unpaired student’s t-test. (B) MDA-hyb5 cells and (C) explant cells from cultured MDA-hyb5-induced tumor #2.5 after dissection were exposed to different chemotherapeutic agents for up to 72 h. Untreated control cells (white bars on the left) were followed by the constant increase in drug concentrations between 0.1 nM and 1 µM (colored bars). After treatment with the corresponding drug at the indicated concentration and incubation time, the cells were lyzed and measured by fluoroscan assay. Data were normalized and relative fluorescence correlated to relative proliferative capacity as previously described [49]. Data represent the mean ± s.d. of three independent experiments with three replicates each. (D) Relative 72 h chemosensitivities for the different drug cytotoxicities were compared between MDA-hyb5 cells and explant cells from cultured mouse tumor #2.5 after dissection. Significance (p) was calculated by unpaired student’s t-test.


