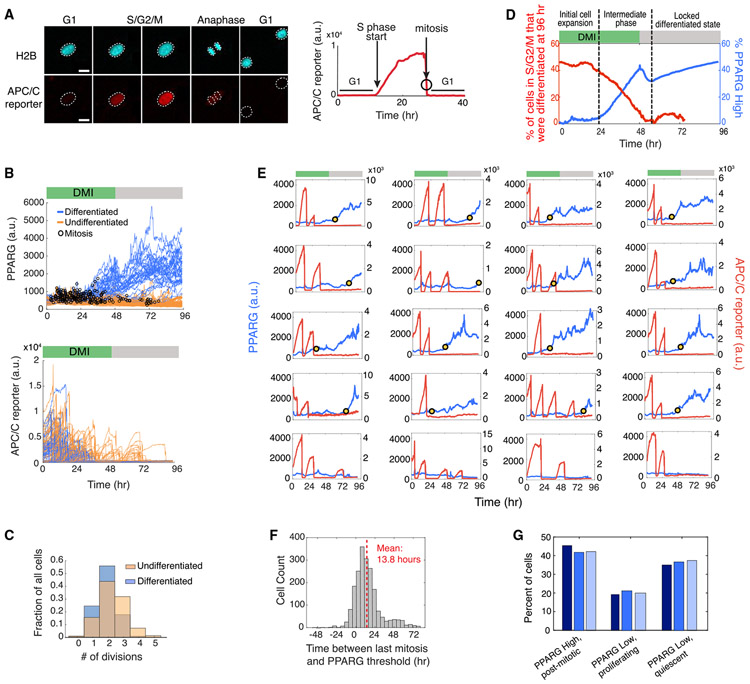
Figure 2. Cells Commit to Terminally Differentiate Exclusively during G1 Phase.
(A) Dual-reporter cells stably expressing APC/C-reporter-mCherry(RFP) and citrine(YFP)-PPARG. Anaphase is shown both by a split in the H2B-mTurquoise signal (top images) and by a sharp drop in APC/C reporter signal (bottom time course). White outlines mark the position of nuclei in cells after anaphase. Scale bar, 20 μm.
(B) Cells were induced to differentiate using the standard 96 h DMI protocol. The dual-reporter cells allow simultaneous measurement in thousands of single cells of differentiation state using PPARG levels (left) and cell cycle state using the APC/C sensor (right). The time points at which mitosis occurred were determined by using the split in H2B signal (black open circles). Representative of four biological replicates.
(C) Comparison of the number of observed mitotic events that occurred in cells that were differentiated versus cells that remained undifferentiated at the end of the 96 h experiment shown in (B).
(D) Plot showing how the fraction of cells in S/G2/M (red) or with PPARG levels higher than the threshold (blue) varies during a 96 h differentiation time course induced by DMI.
(E) Examples of PPARG (blue) and APC/C reporter (red) time courses obtained in the same single cell. Cells were stimulated to differentiate using the standard 96 h DMI protocol. The yellow dot in each plot marks the time at which that cell reached the PPARG threshold and irreversibly committed to the differentiated state. Bottom row shows examples of three undifferentiated/proliferating cells and one undifferentiated/quiescent cell that no longer proliferates even after a serum refresh at 48 h.
(F) Histogram of the difference between the time when the PPARG threshold is crossed and when mitosis last occurred for each cell in the experiment shown in (B). The PPARG threshold is reached on average ~14 h after the last mitosis is completed. The median value is ~11 h. Negative values indicate cells that reached the PPARG threshold before the last mitosis was completed.
(G) Percentage of differentiated/post-mitotic, undifferentiated/proliferating, and undifferentiated/quiescent cells generated in three independent DMI-induced differentiation experiments. Cells with PPARG levels above and below the threshold level are defined to be differentiated (PPARG High) and undifferentiated (PPARG Low), respectively, as described in Figure 1.
See also Figures S2-S4.

