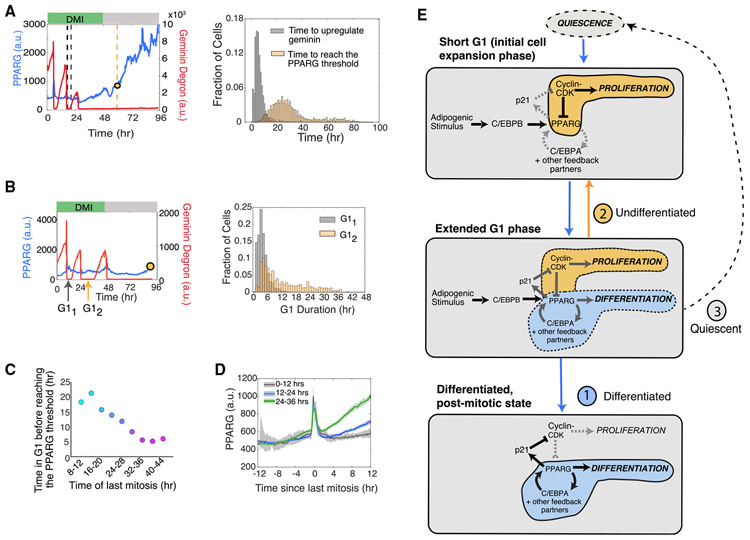
Figure 5. Adipogenic Stimuli Initiate a Competition between the Commitment to Differentiate and Entry into the Next Cell Cycle during a Gradually Extending G1 Phase.
(A) Comparison of the time to commit to the next cell cycle versus time to commit to differentiation in cells that underwent two or three mitoses before differentiating. Right: the end of the second to last mitosis was used as the starting reference time for each cell. Left: histograms comparing the two times measured in the same cell (data from Figure 2B; n > 4,000 cells, representative of four biological replicates).
(B) Left: schematic showing which G1 periods were compared. Right: histograms of the durations of the first and second G1 periods in cells from (A) that have undergone at least three divisions. See also Figure S6.
(C) Differentiated cells from Figure 2B were categorized into nine bins on the basis of the time the cell underwent its last mitosis. Plot showing the average time of the last mitosis versus the average time it took for cells in that bin to increase PPARG levels to the differentiation commitment point.
(D) Differentiated cells from Figure 2B were separated into three groups on the basis of when they last exited mitosis after differentiation stimulus was applied. The traces were aligned by the last mitosis frame. The median PPARG levels were plotted for each group (dark line). Shaded region represents the 95th confidence interval. Note that the spike in the PPARG levels at aligned time point 0 is due to aligning the time courses to mitosis. At this time point, there is an undefined nuclear PPARG signal because the nuclear envelope is broken down and chromatin (H2B) is condensed.
(E) Schematic of the three stages of G1 lengthening in response to adipogenic (DMI) stimuli.
See also Figure S6.

