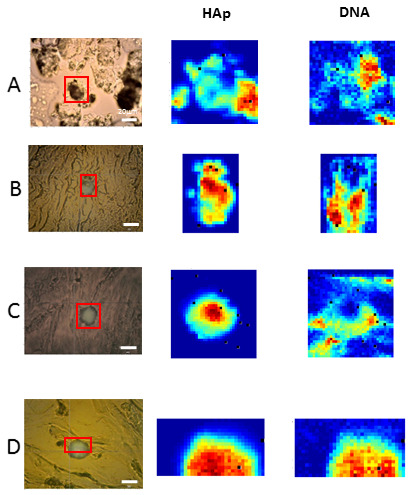
Figure 3.

Raman spectral images of different breast cancer tissue sections showed the presence of DNA in HAp calcifications. First column: Bright field image of the breast tissue section imaged, with a HAp calcification highlighted in the region of interest (red box). Raman images were obtained from this area. Using the MCR algorithm, several molecular components were deconvolved from the spectra. The abundance maps of HAp and DNA molecular components are plotted in the second and third columns. Tissues (A–D) correspond to tissues 20, 22, 1 and 9 in Table 1.
