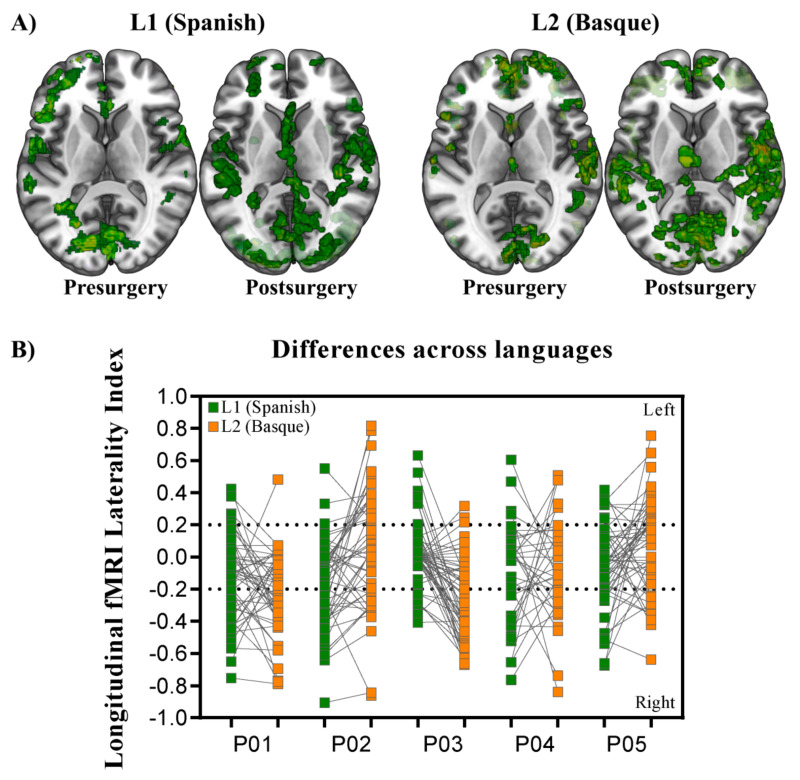
Figure 3.
Group level representation. (A) Superimposition of the individual statistical parametric maps across participants. Each axial slice represents the superimposition resulting from each critical contrast (Language: Spanish and Basque; Time: pre- and post-surgery). MNI single-subject T1 image of MRIcroGL [58]) was used as template. (B) Chart representing longitudinal laterality changes for each of the five patients in L1 (Spanish) and L2 (Basque). Dotted lines represent the statistical threshold typically used for LI changes. Note that longitudinal laterality changes affect both L1 and L2.

