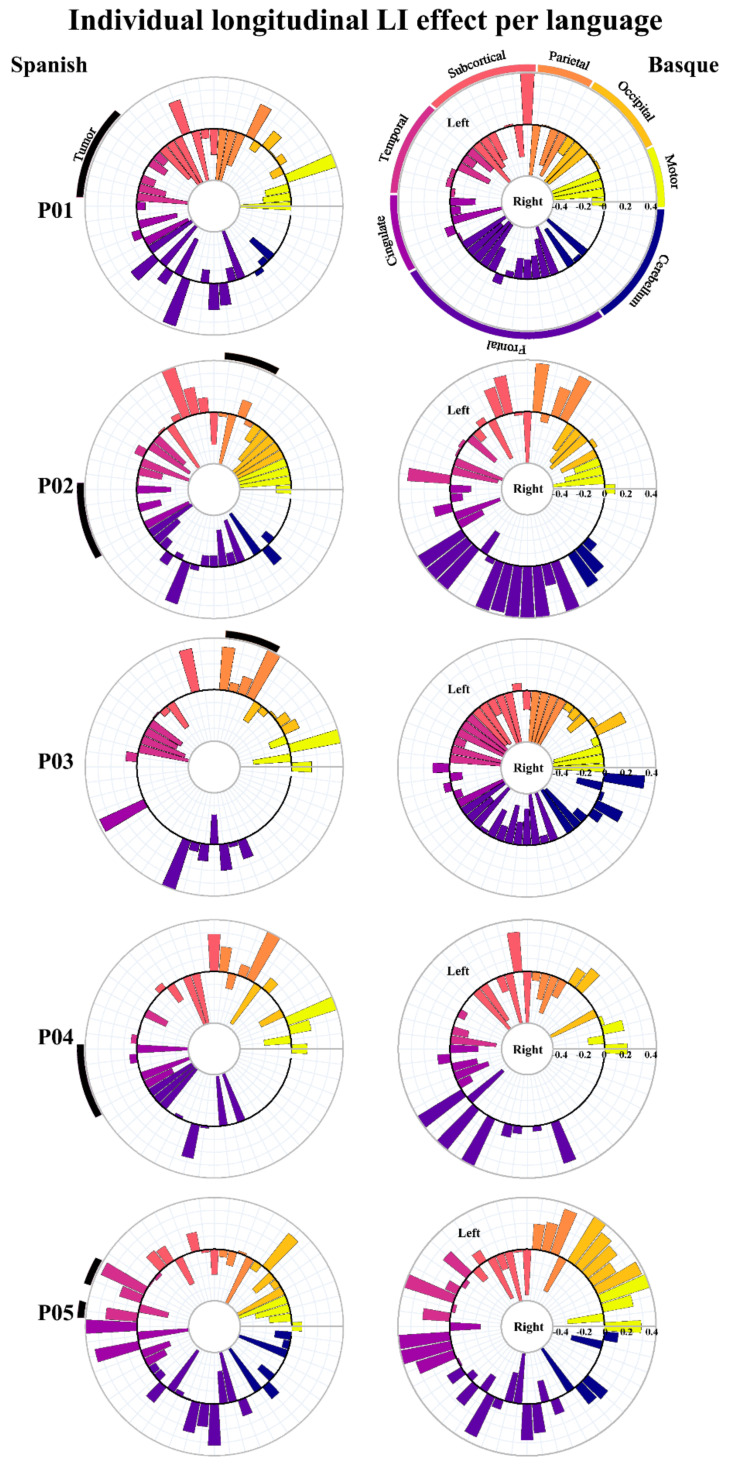
Figure 4.
Charts representing laterality changes of the longitudinal effect for each of the five patients in Spanish and Basque. The middle circle represents zero laterality; bars going from the middle circle toward the outer circle represent increasingly left laterality; bars going from the middle circle toward the inner circle represent increasingly right laterality.

