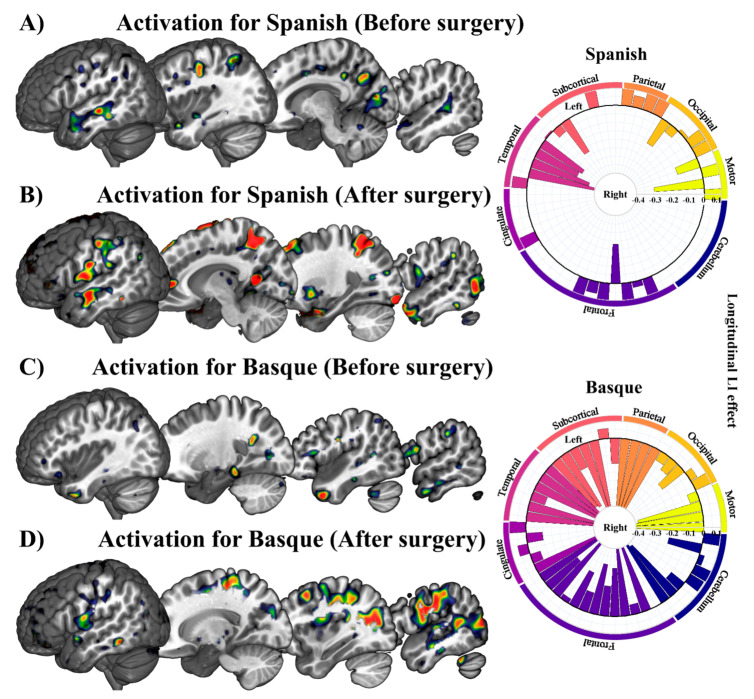
Figure 5.
Statistical parametric maps resulting from each critical contrast in a prototypical patient with low-grade glioma. (A–C), and (D) represent Spanish and Basque before and after surgery, respectively. The chart represents laterality changes in the longitudinal effect for Spanish and Basque in different regions. The middle circle represents zero laterality; bars going from the middle circle toward the outer circle represent increasingly left laterality; bars going from the middle circle toward the inner circle represent increasingly right laterality.

