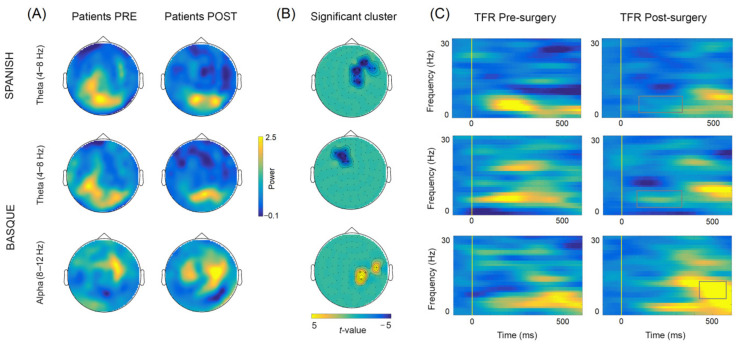
Figure 6.
(A) Topographical power plots for the pre- and post-surgery stages (baselined with 500 ms pre-stimulus period) based on combined gradiometers averaged over the significant time-period within the theta (100 to 350 ms; 4 to 8 Hz) and alpha (350 to 500 ms; 8 to 12 Hz) bands. (B) Significant clusters showing longitudinal differences between conditions (post- vs. pre-surgery). (C) Mean time–frequency representations (TFRs) of the significant sensors within the clusters showing longitudinal power changes.

