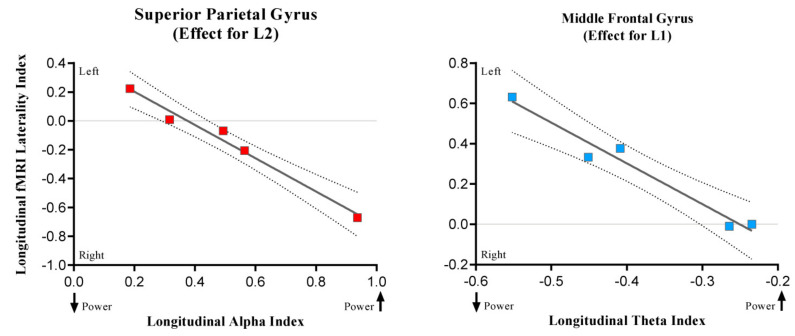
Figure 8.
The scatterplots show significant associations between longitudinal fMRI lateralization indexes and oscillatory longitudinal power changes. While positive LI values indicate leftward lateralization, the negative ones indicate rightward lateralization. The arrows in the upper part of the charts indicate whether the power increases or decreases.

