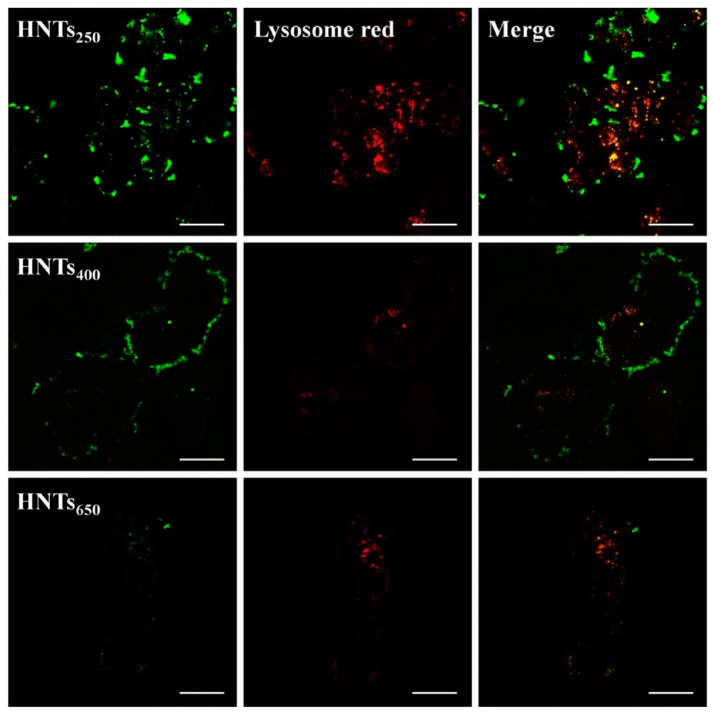
Figure 3.
Intracellular uptake and subcellular distribution of HNTs250, HNTs400, and HNTs650 with HT-29 cells. Scale bar = 25 μm. Reprinted from Colloids and Surfaces A, Vol. 585, Juan Liao, Siyu Peng, Mei Long, Yaya Zhang, Huaming Yang, Yi Zhang, Jing Huang, Nano-Bio interactions of clay nanotubes with colon cancer cells, No. 124242, Copyright (2020), with permission from Elsevier.

