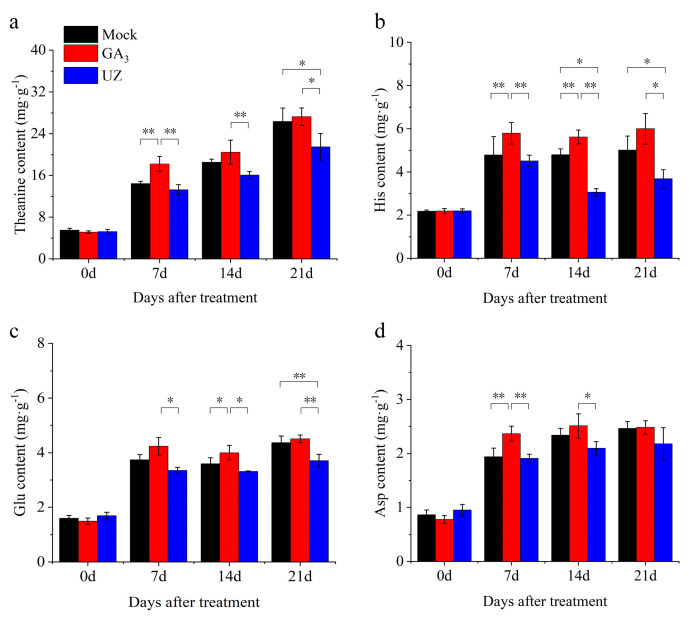
Figure 3.
Response of several abundant amino acids to GA3 in tea leaves. (a)–(d) The change of theanine, histidine (His), glutamate (Glu) and aspartate (Asp) content respectively at 0–21 d after treatment. The values represented the mean ± SE of 30 biological replicates (n = 3, Duncan’s multiple range test). *: Significant difference (p < 0.05); **: Extremely significant difference (p < 0.01).

