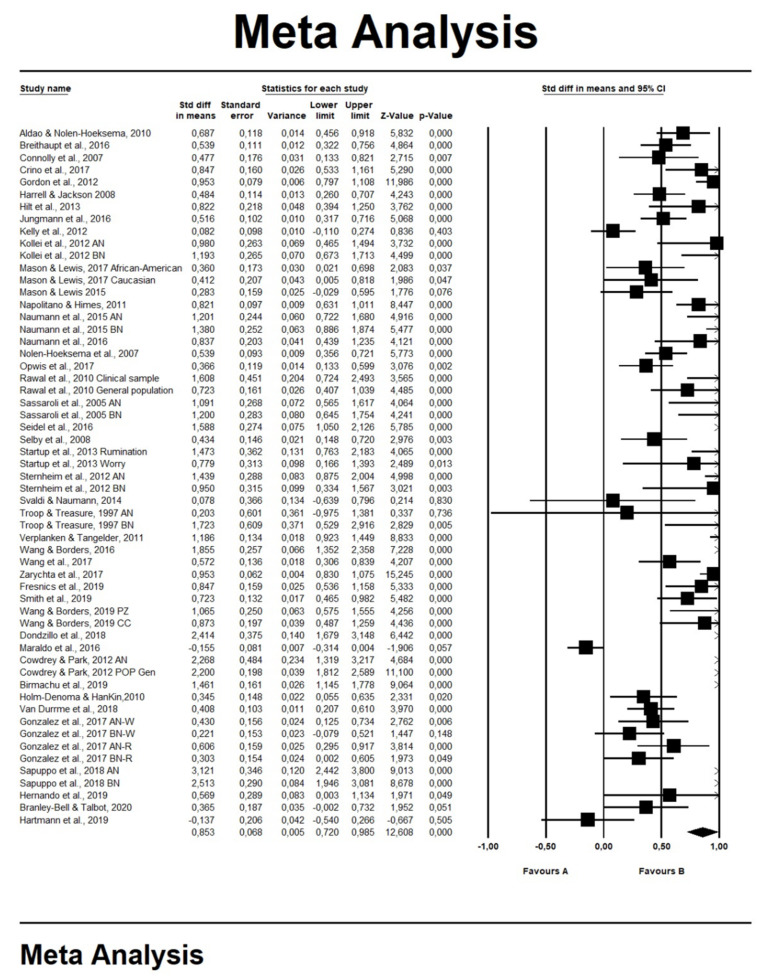
Figure 2.
Forest plots for repetitive thinking and eating behavior. Box indicates effect sizes (ESs), while error bars represent 95% confidence intervals (CIs). The rumble represents the average ES. Note: Favors A = negative association between repetitive thinking and eating disorders. Favors B = positive association between repetitive thinking and eating disorders. The rumble represents the average ES.

