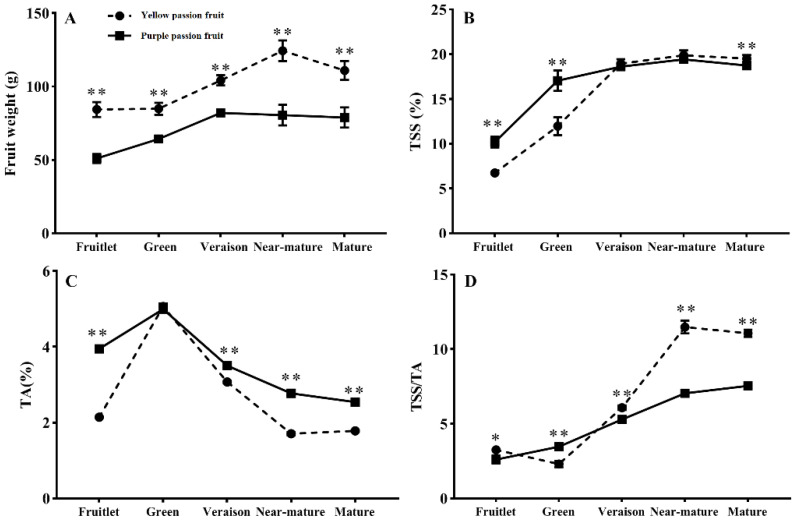
Figure 1.
Changes in fruit weight (A), total soluble solids (TSS) (B), titratable acidity (TA) (C) and sugar-acid ratio (D) of two passion fruit cultivars (i.e., ‘yellow passion fruit’ and ‘purple passion fruit’) during fruit growth and development. Vertical bars indicate means ± SD (n = 15). The * and ** represent significance at p ≤ 0.05 and p ≤ 0.01, respectively, according to Student’s t-test.

