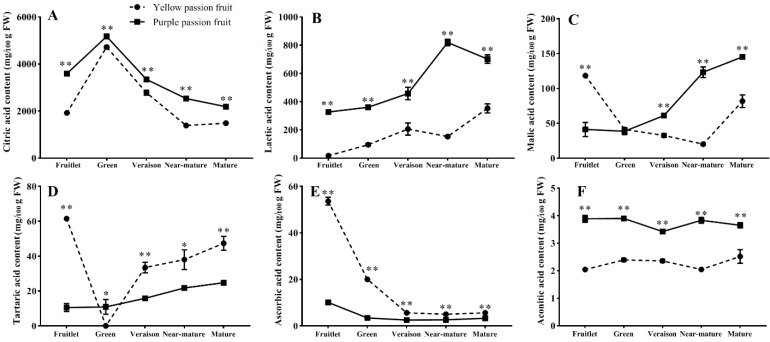
Figure 2.
Changes in citric acid (A), lactic acid (B), malic acid (C), tartaric acid (D), ascorbic acid (E) and aconitic acid (F) of two passion fruit cultivars (i.e., ‘yellow passion fruit’ and ‘purple passion fruit’) during fruit growth and development. Vertical bars indicate means ± SD (n = 3). The * and ** represent significance at p ≤ 0.05 and p ≤ 0.01, respectively, according to Student’s t-test.

