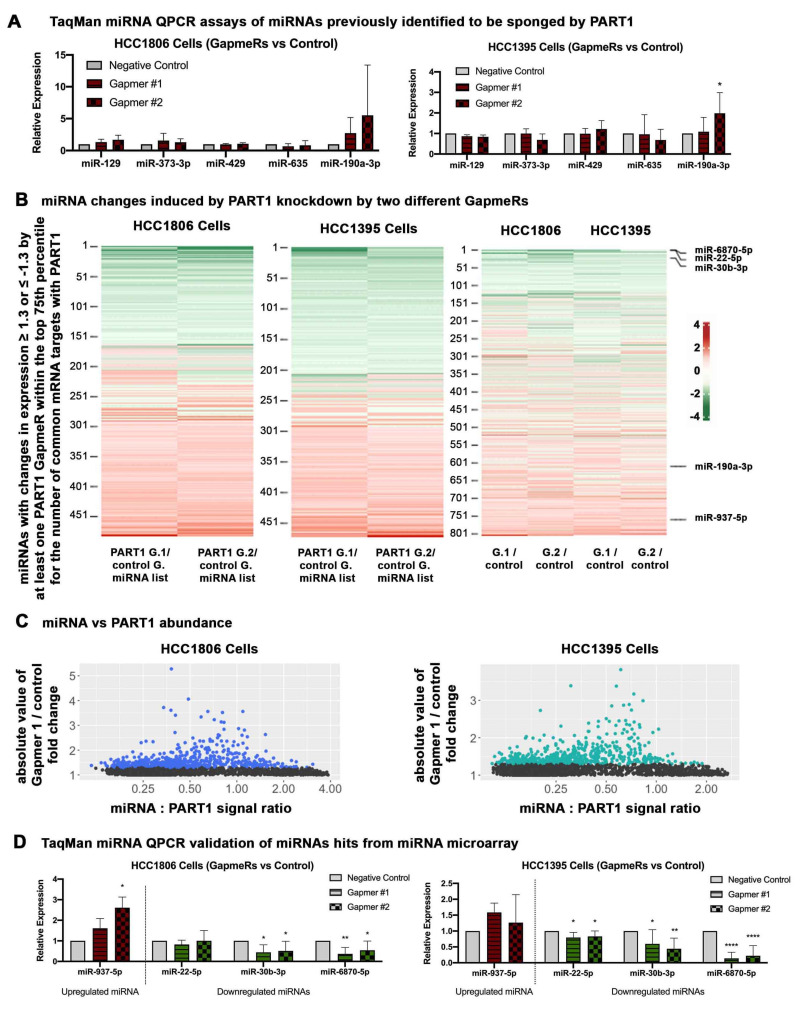
Figure 5.
PART1 knockdown alters the miRNA landscape in HCC1806 and HCC1935 TNBC cells. (A) TaqMan miRNA assays of miRNAs previously implicated as being sponged by PART1 in non-breast cancer cells were assessed in HCC1806 and HCC1935 cells with or without GapmeR-induced knockdown of PART1 (Gapmer1 (G.1) or Gapmer2 (G.2) versus control GapmeR (control G.) (n = 4–8, significance determined by one-way ANOVA, followed by Dunnett’s post-test for multiple comparisons). Error bars represent SD. miR-129, miR-373-3p, miR-429 and miR-635 levels were quantified by the TaqMan miRNA assays and the expression is normalized to reference miRNAs RNU48 and miR-221. miR-190a-3p levels were quantified by the TaqMan miRNA Advanced assays and expression is normalized to reference miRNAs miR-21-5p and miR-26b-5p. (B) The heatmaps show miRNAs with an expression fold change ≥1.3 or ≤−1.3 and within the top 75th percentile for the number of common mRNA targets with PART1 regulated mRNAs (corresponding to at least 15 common genes in HCC1806s cells and 9 in HCC1395 cells) induced by at least one PART1-specific GapmeR. (C) The abundance of all the miRNAs in the 4.0 miRNA gene chip array relative to PART1 (abundance extrapolated from File S2) detected in the in the negative control samples were calculated for HCC1806 and HCC1395 cells (average of 3n). (D) TaqMan miRNA advanced assays of some of the miRNAs identified as being upregulated or downregulated by PART1 knockdown in HCC1806 of HCC1935 cells in the gene chip array in (C) (n = 7–8, significance determined by one-way ANOVA, followed by Dunnett’s post-test for multiple comparisons, and expression is normalized to reference miRNAs miR-21-5p and miR-26b-5p). Significant p values are indicated as follows in the figures: p < 0.05 = *, p < 0.01 = **, p < 0.0001 = ****.

