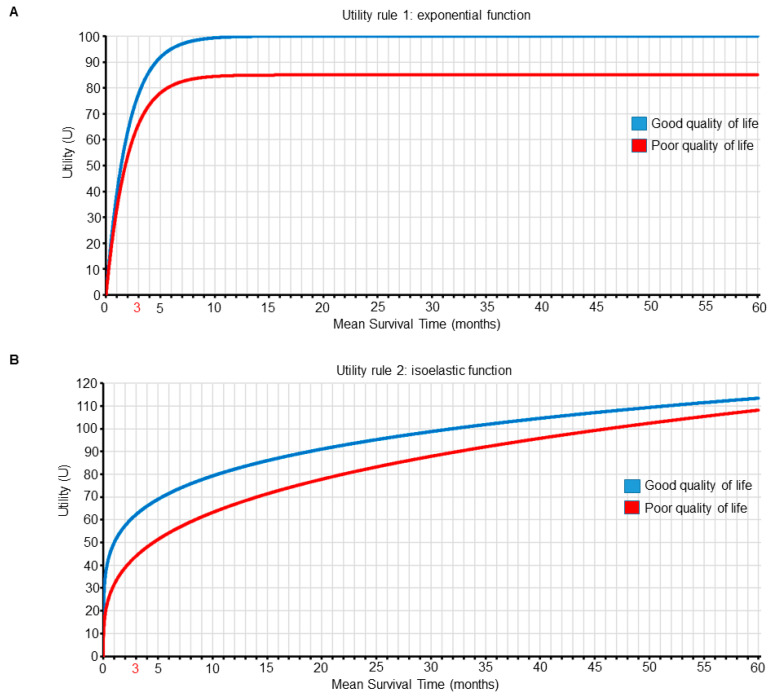
Figure 5.
Two different utility functions of mean survival time (m, in months) and quality of life (QOL). Each curve is plotted as a function of m for each QOL subgroup (good versus poor). Panel A shows the first utility function, which is an exponential function of m that places more value on surviving for longer than 3 months. The utility function of m for good QOL is U1(m, good QOL) = (1 − e−m·0.5) · 100, and for poor QOL is U1(m, poor QOL) = (1 − e−m·0.5) · 85. Panel B shows the second utility function, which places more value on QOL differences for shorter survival times. The utility function for good QOL is U2(m, good QOL) = 10 · m0.2/0.2, and for poor QOL is U2(m, poor QOL) = 9.5 · m0.3/0.3.

