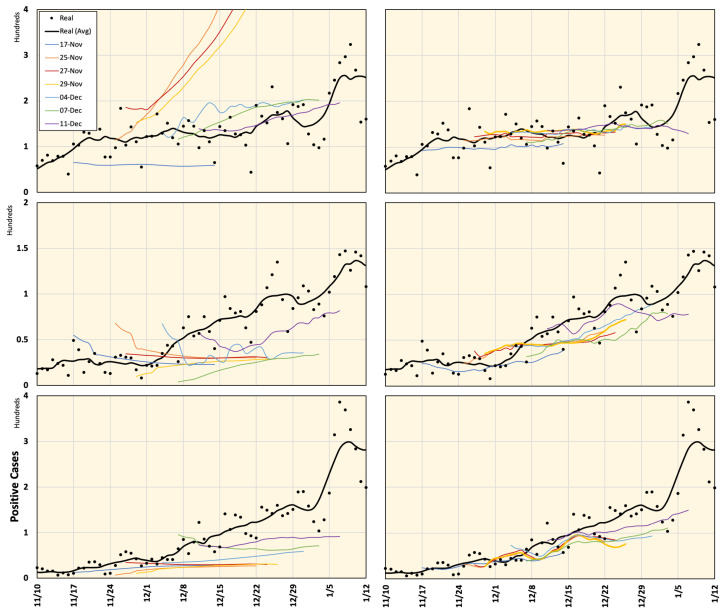
Figure 7.
Prediction of COVID-19 positive cases in Hyogo, Kyoto, and Fukuoka (from top to bottom) released by Google Cloud (left) and computed using the proposed framework (right), compared to the actual real data for different time frames defined in Figure 5. All plots represent a 7-day average value.

