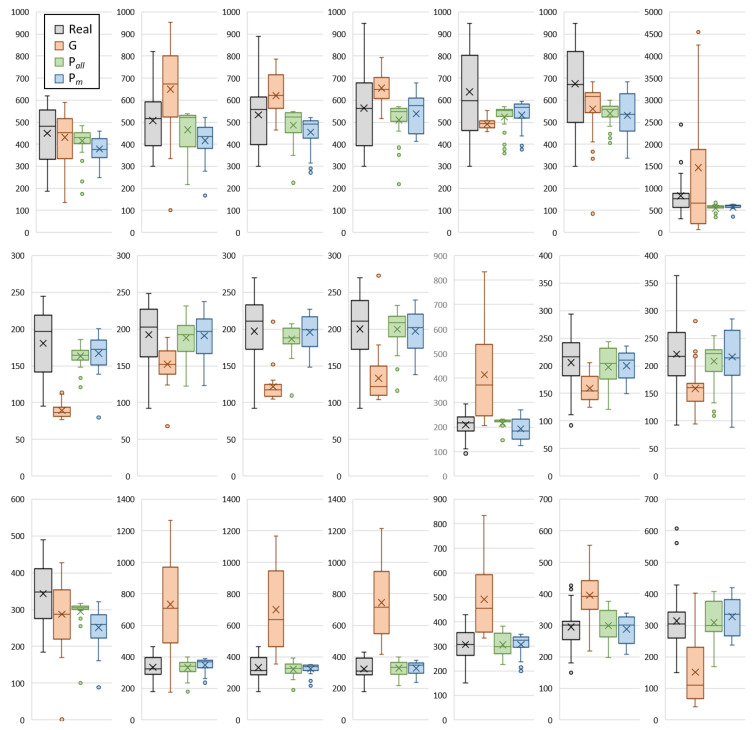
Figure 9.
Boxplots demonstrate real (R) and estimated positive cases using Google Cloud forecast (G) and the proposed framework (mobility + meteorological factors) (P) and mobility only (P) for Tokyo (top), Aichi (middle), and Osaka (bottom). Plots represent seven time periods in chronological order from left to right.

