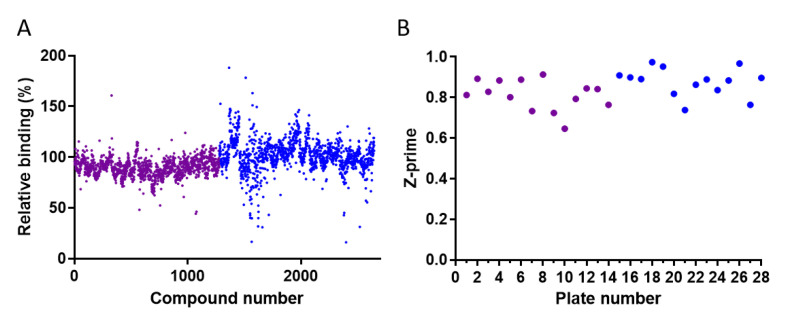
Figure 2.
High-throughput screening of the LOPAC®1280 and DiscoveryProbeTM compound libraries for inhibitors of the RBD-ACE2 interaction. Each compound was tested at 10 µM. (A) Distribution of the relative RBD-ACE2 binding values in the presence of the compounds. (B) Distribution of the Z-prime values of each plate. The purple and blue dots correspond to LOPAC®1280 and DiscoveryProbeTM, respectively.

