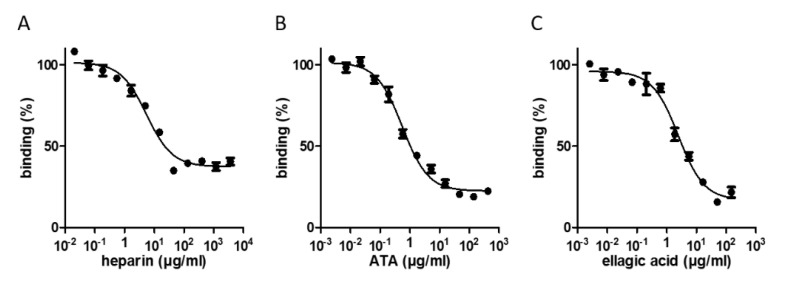
Figure 3.
Dose–response relationships between the hit compound concentrations and RBD-ACE2 binding. Inhibition profiles of the RBD-ACE2 interaction in the presence of increasing concentrations of heparin sodium (A), ATA (B), and ellagic acid (C), determined by the binding assay. The values are the average of triplicates ± SEM. The IC50 values are listed in Table 1.

