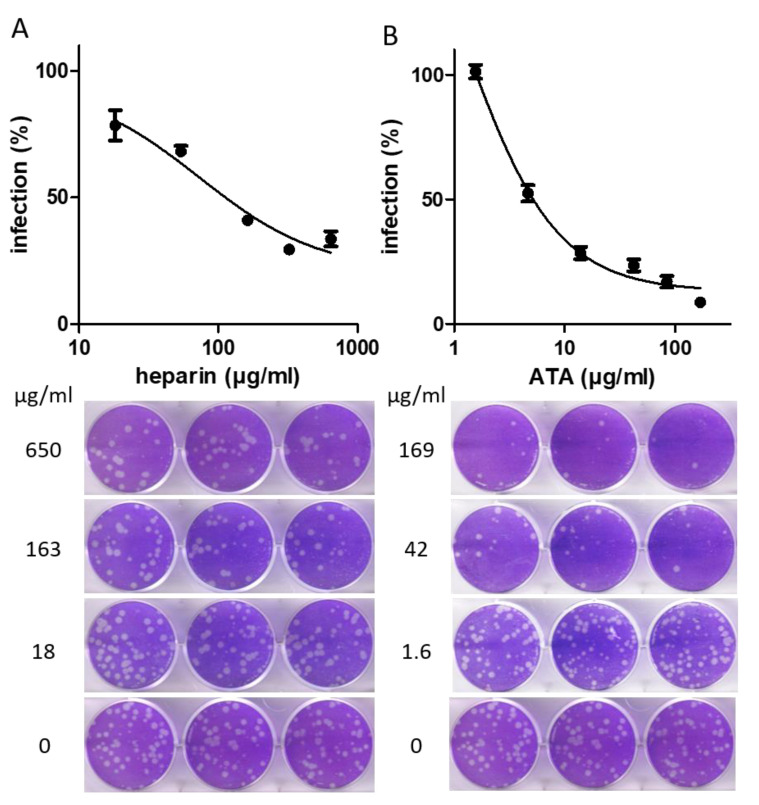
Figure 4.
Inhibition of viral infection of cells by heparin sodium and ATA. rVSV-SARS-CoV-2-S was preincubated for 1 h with the indicated concentrations of heparin sodium (A) and ATA (B). Mixtures were then added to Vero E6 cells and incubated for 72 h. Cells were then stained using crystal violet, and the relative plaque reduction was determined. The results are expressed as the percent inhibition relative to that of the virus-only control incubated with the corresponding solvent (infection medium without or with 2% DMSO for heparin sodium or ATA, respectively). The values are presented as the mean of 6-well replicates ± SD. The lower images are three representative wells with the indicated compound concentrations.

