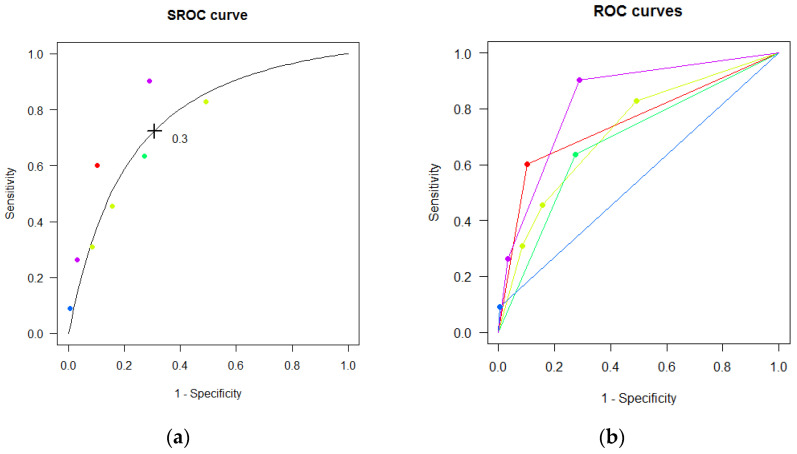
Figure 2.
Multiple thresholds (a) SROC and (b) ROC curves for FibroTest in detecting advanced fibrosis. Each point represents a reported threshold value, points of the same color represent thresholds reported within the same study. The cross in the SROC curve indicates the Youden-based threshold value: Youden-threshold: 0.30, sensitivity: 0.72 (95% CI: 0.52; 0.87), specificity: 0.69 (95% CI: 0.49; 0.84), AUC: 0.77 (95% CI: 0.64; 0.86).

