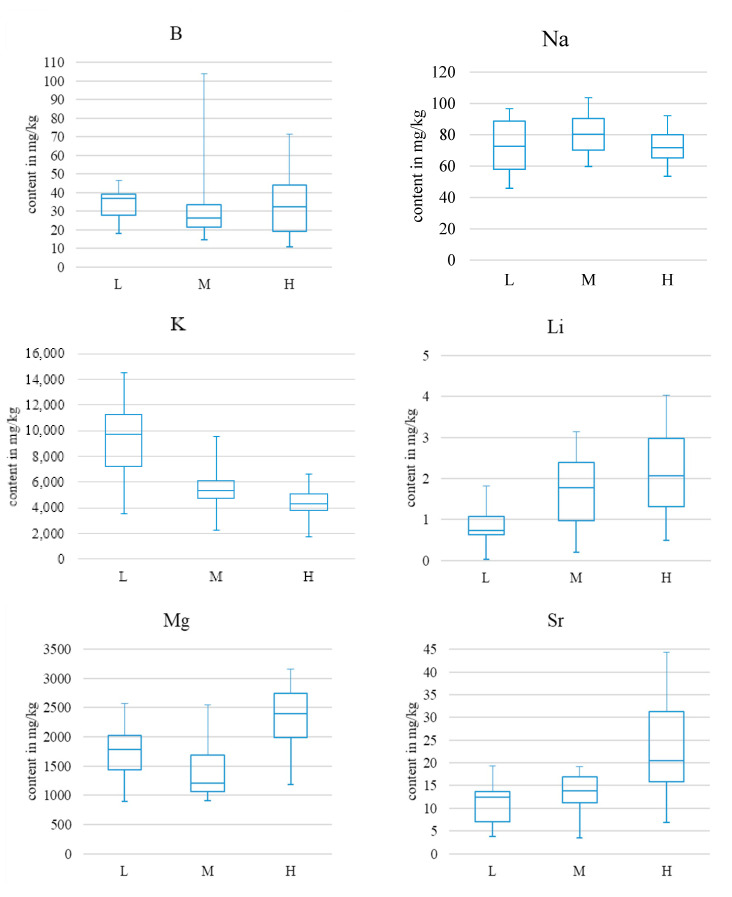
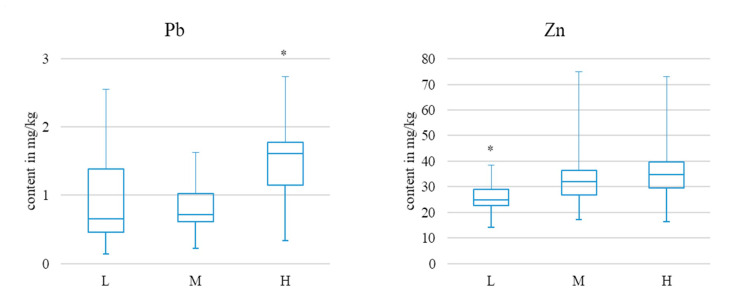
Figure 5.
Box-and-whisker plots for selected elements Ba, Na as examples for notbeing statistically different; K, Li, Mg, and Sr being different between all sampling sites; Pb and Zn being different at one site. (L = low traffic volume; M = medium traffic volume; H = high traffic volume). *—statistically significant difference.


