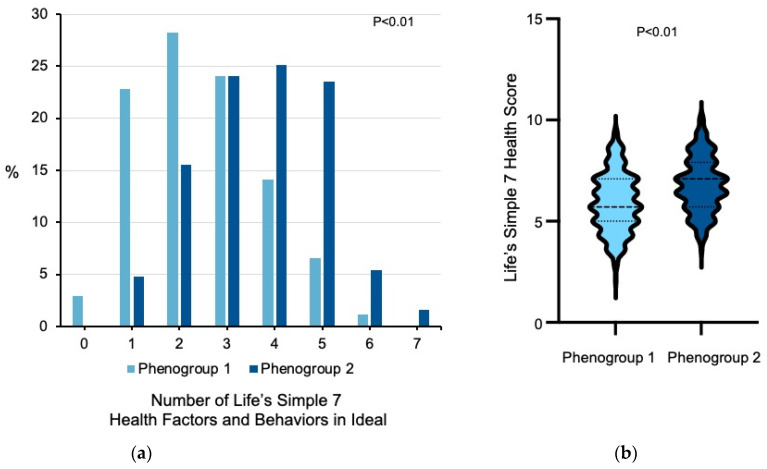
Figure 3.
Former smoker phenogroups and measures of ideal cardiovascular health. (a) Life’s Simple 7 health factors and health behaviors are scored according to predefined criteria as poor, intermediate, or ideal. For each former smoker in phenogroup 1 (n = 241) and phenogroup 2 (n = 187), the number of health factors or behaviors that were scored in the ideal category is shown. Data was analyzed using the Wilcoxon rank sum test. (b) The distribution of Life’s Simple 7 Health Scores for former smokers in each of the phenogroups is presented as violin plots. The median and quartiles are denoted by dashed lines. Data was analyzed using the Wilcoxon rank sum test.

