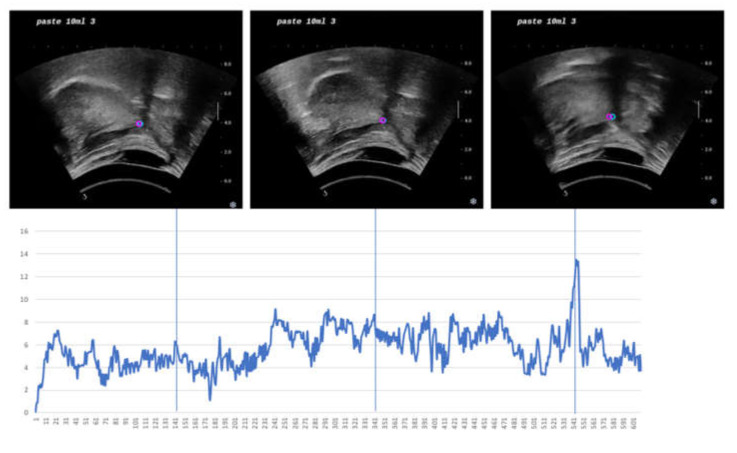
Figure 7.
Performance plot. Center error of all frames from a test sequence in full-length where the female swallows 10 mL of paste liquid. The y-axis is a center error in pixel and the x-axis is frame number. Three example images from every 200 frames were chosen and displayed above the plot. The pink dot represents the center of inference, and the blue dot represents the center of ground truth (annotation).

