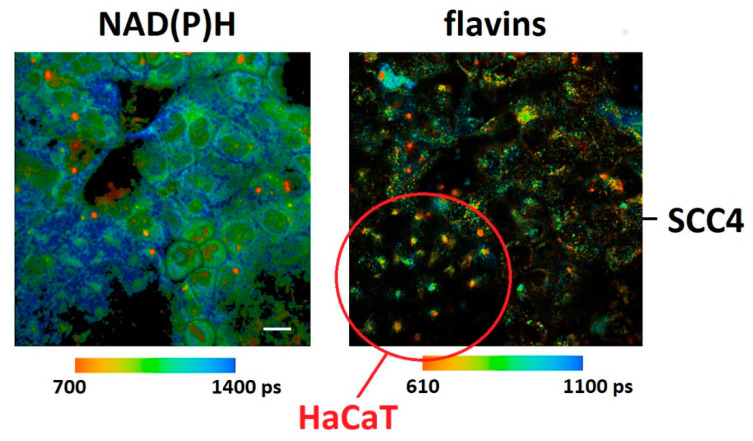
Figure 4.
Fluorescence lifetime images of co-cultured HaCaT and SCC4 cells. The autofluorescence of NAD(P)H was recorded in the “green” (426–446 nm) spectral channel under 780 nm two-photon excitation whereas the autofluorescence of flavins was collected in the “red” (542–582 nm) spectral channel under 880 nm two-photon excitation. Scale bar 20 µm.

