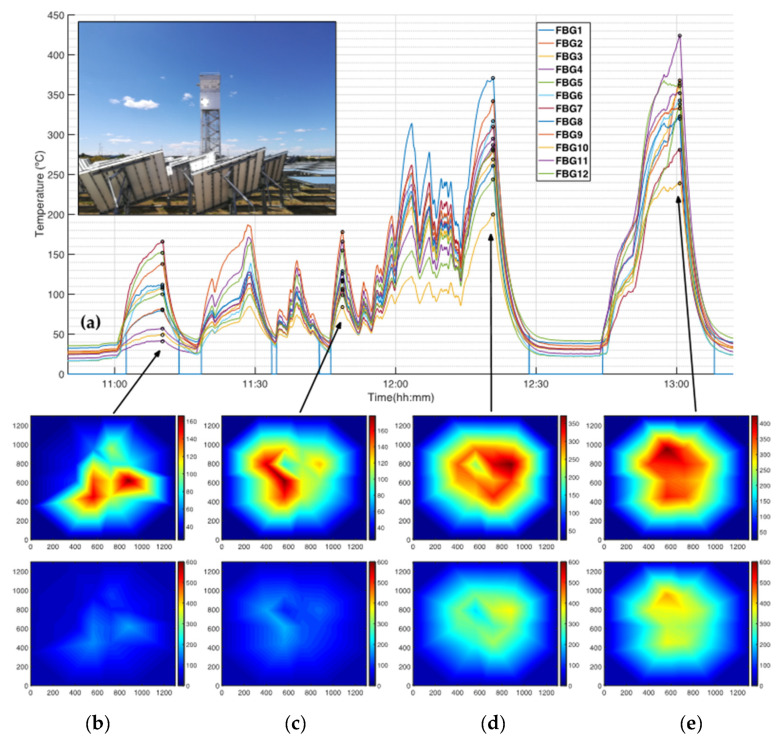
Figure 8.
FsFBGs temperature measurements and corresponding HTSDs at the central receiver prototype for quasi-uniform flux distributions at the prototype receiver: (a) FsFBGs temperature measurements as a function of time (the inset represent the concentrated solar radiation at the receiver prototype to obtain quasi-uniform flux distributions); (b) HTSD from FsFBGs temperature data at 11:10:12—up, using a relative colormap, and down using an absolute colormap; (c) HTSD from FsFBGs temperature data at 11:48:38—up and down, using a relative and absolute colormap, respectively; (d) HTSD from FsFBGs temperature data at 12:20:47—up and down, using a relative and absolute colormap, respectively; (e) HTSD from FsFBGs temperature data at 13:00:39—up and down, using a relative and absolute colormap.

