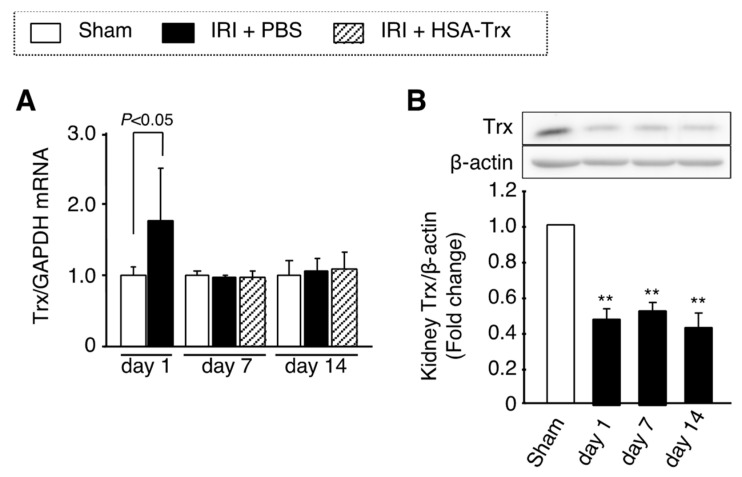
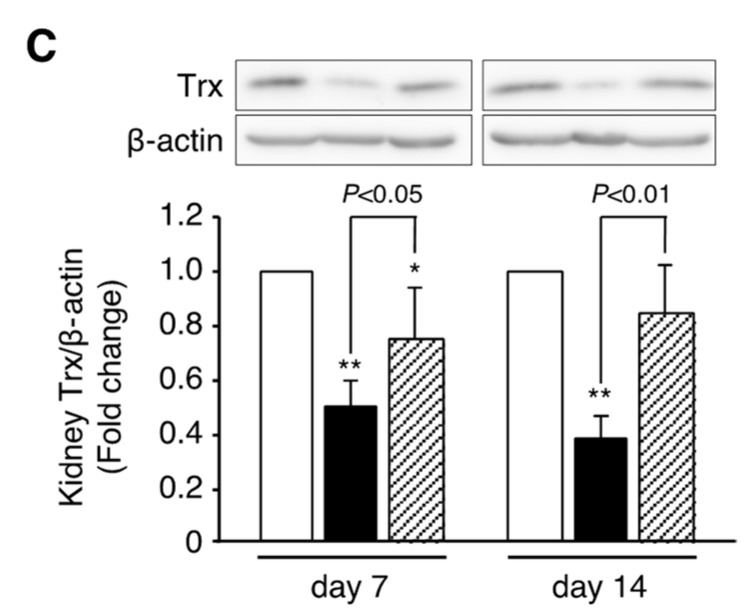
Figure 5.
Effect of HSA-Trx on endogenous Trx expression in kidney of renal IR-treated mice. (A) Trx mRNA expression in kidney on 1, 7 and 14 days after renal IR were determined by real-time PCR. (B) Trx protein expression in kidney on 1, 7 and 14 days after renal IR, and (C) Trx protein expression in kidney on 7 and 14 days after renal IR with or without HSA-Trx treatment were assessed by Western blotting. The intensity of each band was quantified using the ImageJ software program and normalized against β-actin expression. Data are expressed as the mean ±SD (n = 4). * p < 0.05, ** p < 0.01 compared with sham mice.


