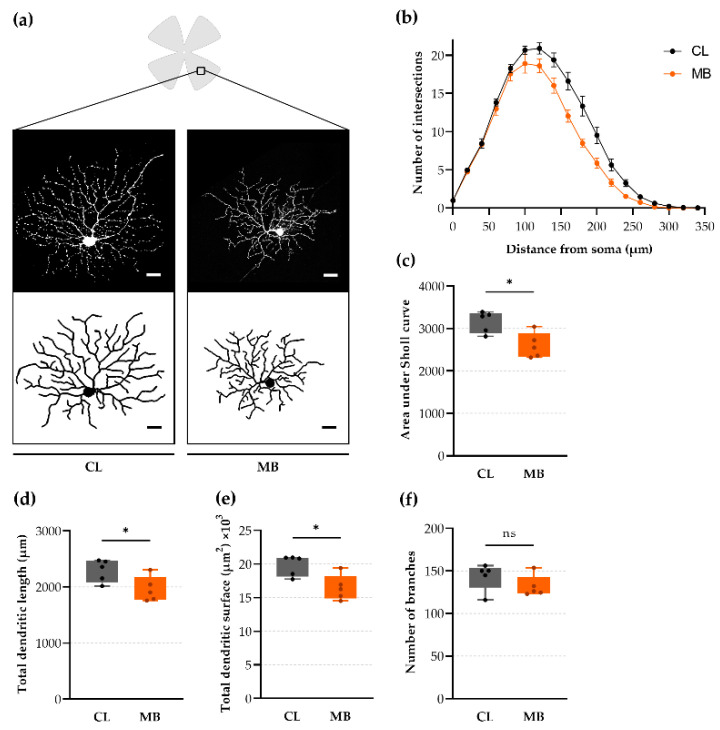
Figure 4.
Dendritic architecture was affected by microbead injection. (a) Z-stack projection of αRGCs (SMI32-immunopositive) from a Thy1-YFP-H sparsely labeled mouse in the peripheral retina, together with the corresponding en-face view of the dendritic tree, traced with Matlab’s TREES toolbox. Scale bar = 20 µm. (b,c) Average (± SEM) Sholl profiles (b) (i.e., the number of dendrites intersecting concentric circles with a radius increment of 20 µm) and area under the Sholl curve (c) revealed dendritic retraction upon microbead injection. (d–f) Dendritic arbor analysis revealed a markedly lower dendritic length (d) and tree surface (c), whilst a trend towards a lower number of branches was observed (e). Unpaired two-tailed t-tests, ns = non-significant, * p ≤ 0.05, n = 5. CL = contralateral eyes and MB = microbead-injected eyes.

