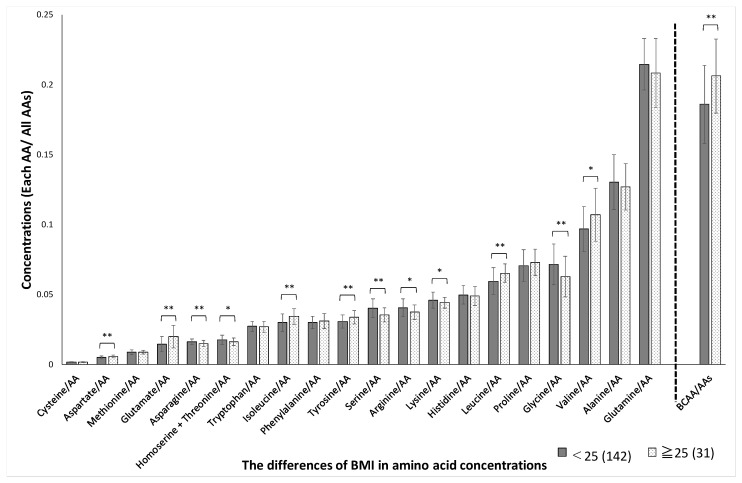
Figure 3.
BMI-related differences in amino acid concentrations. The absolute concentration was divided by the total AA concentration, yielding the relative concentration. Participants were divided into two groups based on BMI 25. AAs, amino acids; BCAAs, branched-chain amino acids BCAAs, branched-chain amino acids. * p < 0.05, ** p < 0.01 in BMI < 25 versus BMI ≥ 25.

