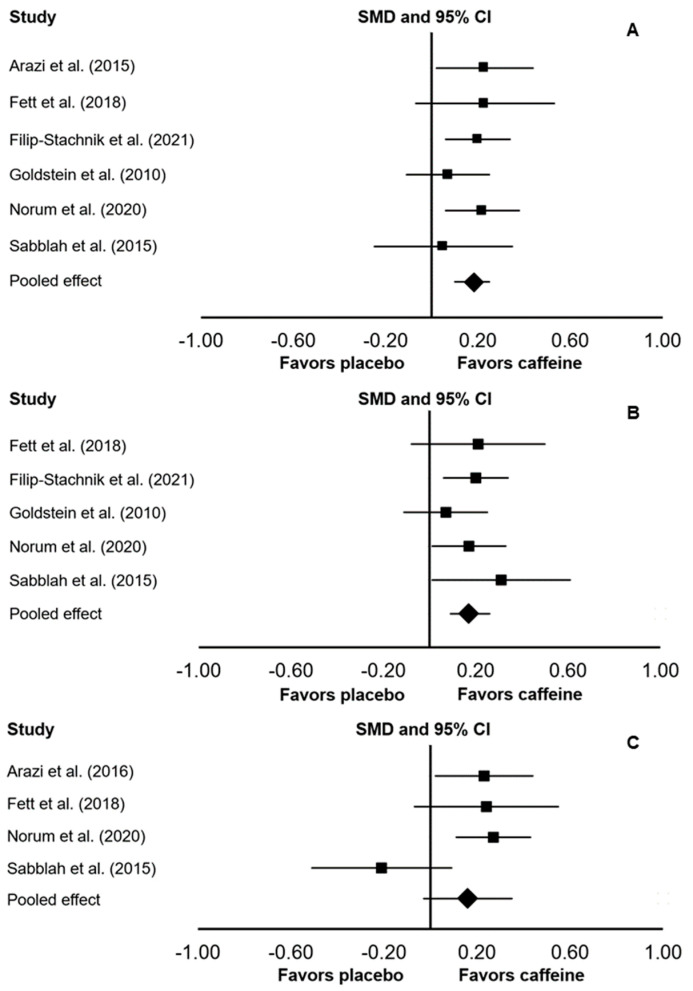
Figure 3.
Forest plot presenting the results of the random-effects meta-analysis comparing the effects of placebo vs. caffeine on one-repetition maximum (1RM) muscular strength while considering all studies (A), only upper-body 1RM tests (B), or only lower-body 1RM tests (C). Data are reported as standardized mean differences (SMD) and 95% confidence intervals (CIs). The diamond at the bottom presents the overall effect. The plotted squares denote SMD, and the whiskers denote their 95% CIs.

