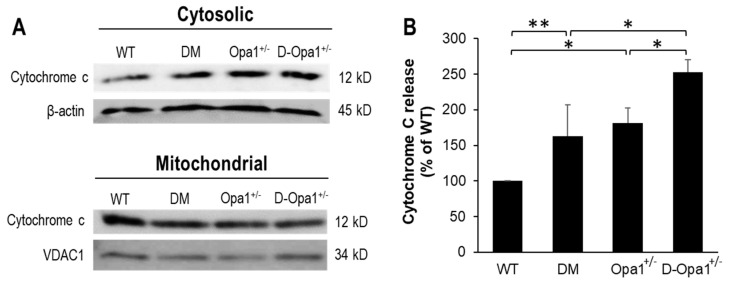
Figure 4.
Reduced Opa1 expression in diabetic Opa1+/− mouse retinas accelerates cytochrome c release. (A) Representative WB image shows cytochrome c levels in cytosolic and mitochondrial fractions in retinas of WT, diabetic (DM), Opa1+/−, and diabetic Opa1+/− (D-Opa1+/−) mice. (B) Graphical illustration of cumulative data shows diabetes and reduced Opa1 level significantly upregulate cytochrome c release, and that further reduction in Opa1 expression in retinas of D-Opa1+/− mice results in greater elevation in cytochrome c release. Data are expressed as mean ± SD. * p < 0.01, n = 6; ** p < 0.05, n = 6.

