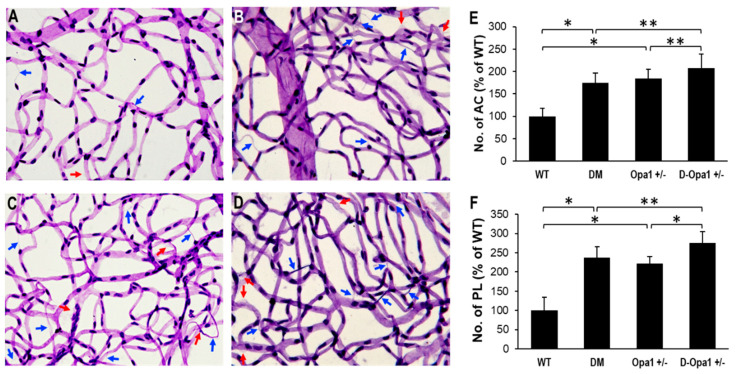
Figure 6.
Effects of diabetes or decreased Opa1 level on AC and PL development in mouse retinas. (A–D) Representative images of retinal capillaries from (A) WT, (B) DM, (C) Opa1+/−, and (D) D-Opa1+/− mice show an increased number of AC (blue arrows) and PL (red arrows) in the diabetic mouse retina compared with those of the control mouse retina; 40× magnification. Importantly, the number of AC and PL is increased in retinas of D-Opa1+/− mice compared with that of diabetic mice. Graphical illustrations of cumulative data show reduced Opa1 levels in the D-Opa1+/− mouse retina exacerbates the development of (E) AC and (F) PL. Data are expressed as mean ± SD. * = p < 0.01, n = 12; ** = p < 0.05, n = 12.

