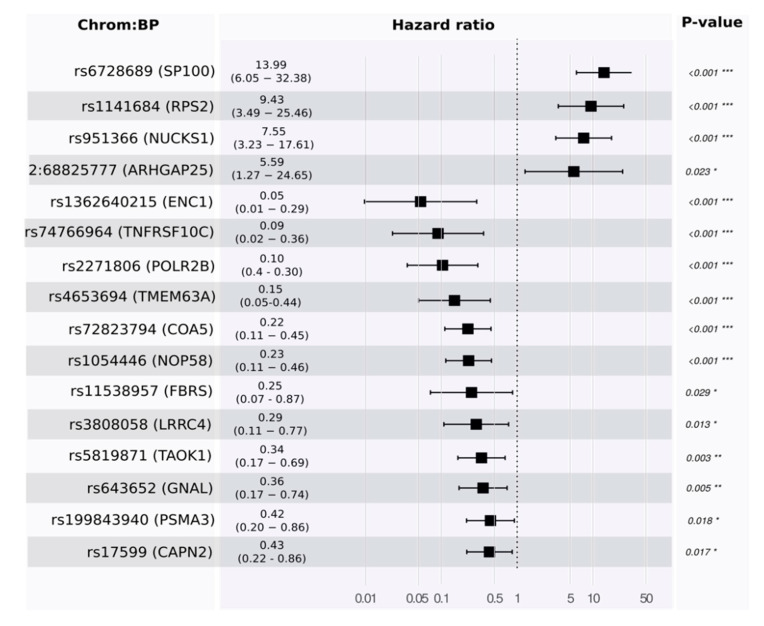
Figure 4.
Forest plot for the proportional hazard model to visualize the size effect of the 16 significant variants in estimating survivals in rPDAC. The asterisks symbols next p-values are used to highlight the significance; the more asterisks, the higher the significance. Global p-value (Log-Rank) = 2.284 × 10⁻²²; Concordance = 0.89.

