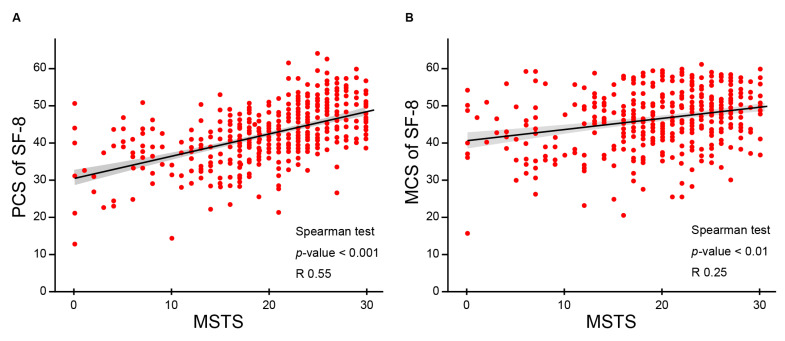
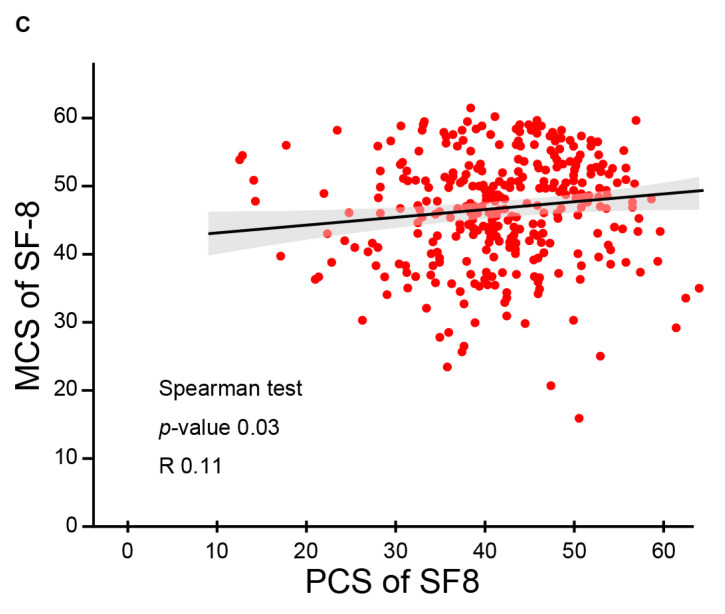
Figure 3.
Scatter plots for MSTS scores and PCS and MCS of SF-8 are shown. Correlation estimates were generated and regression lines were drawn. The scores at all follow-up points were plotted. (A) MSTS scores were positively correlated with the PCS of SF-8. (B) MSTS scores were weakly positively correlated with the MCS of SF-8. (C) The PCS and MCS of SF-8 showed a weak positive correlation.


