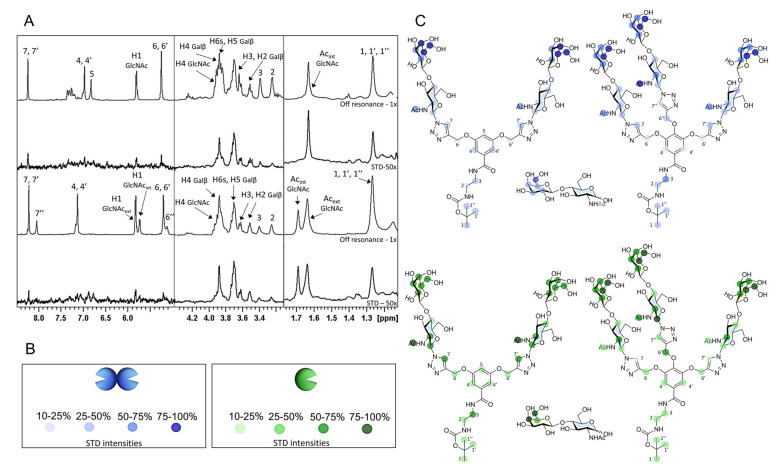
Figure 2.
1H-STD-NMR results. (A) 1H STD-NMR spectra of the mixtures of Gal-1 (100 µM) with compounds 2 and 3 using a lectin/ligand molar ratio of 1:30 and 2 s of saturation time. From top to bottom: Off-resonance spectrum with annotations of the main 1H signals showing STD for the complex Gal-1/2; STD spectrum obtained upon irradiation at δ −0.5 ppm; off-resonance spectrum with annotations of the main 1H signals showing STD for the complex Gal-1/ligand 3; STD spectrum obtained upon irradiation at δ −0.5 ppm. (B) Color legend of the representation of the relative STD intensities for each lectin. (C) Epitope mapping derived from the 1H-STD-NMR for the interaction of human Gal-1 (blue) and Gal-3 (green) with 1, 2, and 3.

