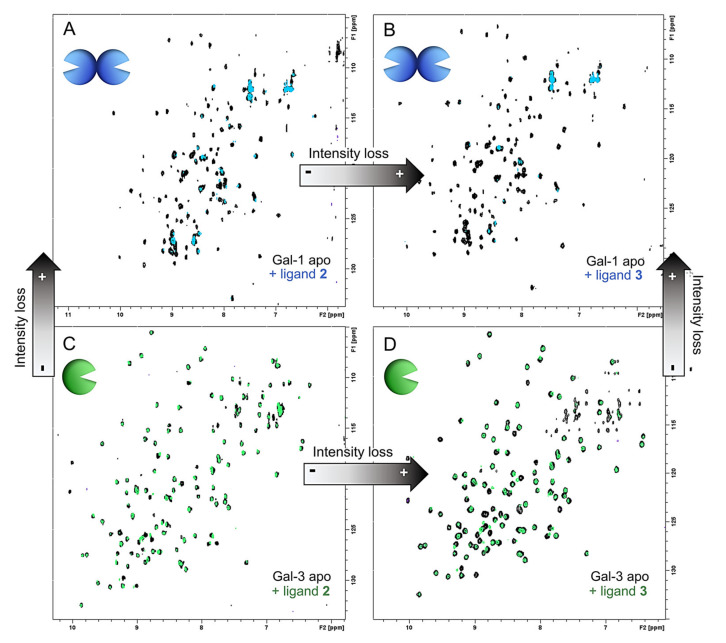
Figure 4.
Comparison of the total relative (bound versus apo) loss of intensity of 1H-15N HSQC spectra. (A) Stacked 1H-15N HSQC spectra of Gal-1 apo (black) and Gal-1 upon addition of 5 equivalents (10 active equivalents) of 2 (light blue). (B) Stacked 1H-15N HSQC spectra of Gal-1 apo (black) and Gal-1 upon addition of 2.5 equivalents (7.5 active equivalents) of 3 (light blue). (C) Stacked 1H-15N HSQC spectra of Gal-3 apo (black) and Gal-1 upon addition of 5 equivalents (10 active equivalents) of 2 (green). (D) Stacked 1H-15N HSQC spectra of Gal-3 apo (black) and Gal-1 upon addition of 2.5 equivalents (7.5 active equivalents) of 3 (green).

