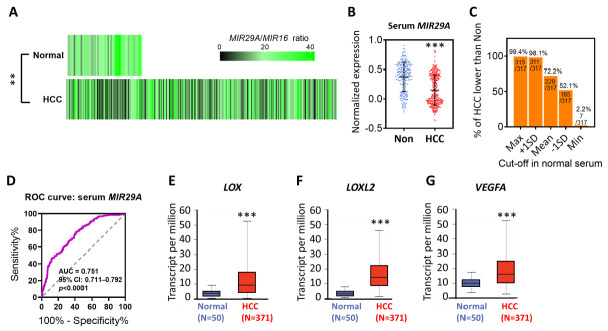
Figure 1.
Differential expression analysis of MIR29A, LOX, LOXL2, and VEGFA in HCC patients as compared to normal individuals. (A) Heatmap of MIR29A expression level in normal tissue and HCC, wherein 51 and 375 TCGA datasets were respectively accessed in the OncoMir Cancer Database (OMCD). MIR16 expression level served as normalization control. ** p < 0.01 between normal and HCC group. The raw data of TCGA samples retrieved from OMCD are shown in Supplementary File S1. (B) Serum MIR29A expression level of HCC patient and non-cancer individuals retrieved from the GSE113740 dataset. MIR16 expression level served as the normalization control. *** p < 0.001 between the non-cancer (Non) and HCC group. (C) The number (%) of HCC patients presenting a lower value than normal individuals at the cut-off of maximum, mean + 1SD, mean, mean-1SD, and minimum value of normal serum. (D) Receiver operating characteristic (ROC) curves for non-cancer and HCC cohorts based on serum MIR29A levels from the GSE113740 dataset. The gene expression level of LOX (E), LOXL2 (F), and VEGFA (G) in HCC and normal tissue retrieved from TCGA datasets. ** p < 0.01, *** p < 0.001 between the normal and HCC group. Panel E, F and G were adapted form UALCAN, which is an open assessed web server.

