Figure 2.
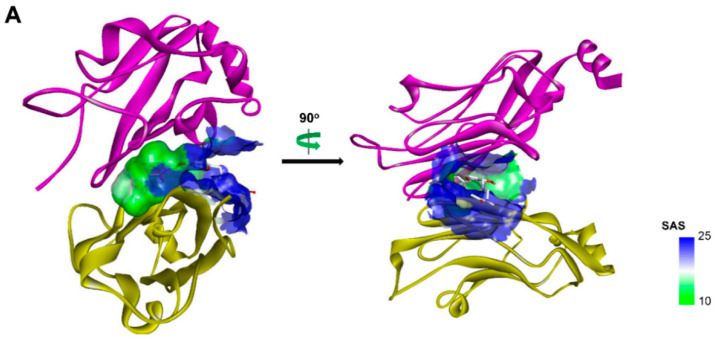
(A) Crystal structure of PD-L1 (chain A, yellow; chain B, purple)/BMS-202(white) complex (PDB code: 5J89). Receptor surfaces, covering atoms that are close to the current ligand, are colored by solvent accessibility surface (SAS). The default color spectrum used is green–white–blue, and small values (green) correspond to buried residues, whereas large values (blue) correspond to exposed residues. This picture was drawn by Discovery Studio Visualizer [29]. (B) Strctural simplification strategy of this work. (C) Putative binding modes of A1 in the binding pocket of PDL1 dimer structure. Dashed lines represent the inter-interaction between A1 and protein, specifically, green ones indicate hydrogen bond, dark green ones indicate cation–π interaction, purple ones indicate ionic interaction, and sky-blue ones indicate π–π interaction.


