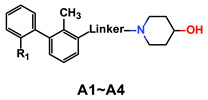
Table 1.
Activities of compounds A1–A4 in inhibition of the PD-1/PD-L1 interaction.

| Compd. | R1 | Linker | Inhibitory Rate (%) | IC50 (nM) a | MW | ALogP b | PSA b | LE c | |
|---|---|---|---|---|---|---|---|---|---|
| 1 μM | 0.1 μM | ||||||||
| A1 | CH3 |

|
90 | 56 | 113.6 | 339.22 | 2.38 | 33.90 | 0.38 |
| A2 | F |

|
6.7 | 8.5 | N.D. | 382.24 | 2.09 | 27.91 | ND |
| A3 | F |

|
96.2 | 74.5 | 18.4 | 405.21 | 5.05 | 32.70 | 0.35 |
| A4 | F |

|
98.0 | 71.0 | 21.9 | 406.21 | 4.86 | 45.59 | 0.36 |
| BMS1058 | 0.48 d | 753.33 | 4.04 | 132.41 | 0.24 | ||||
| BMS202 | 18.0 | 419.22 | 4.04 | 72.48 | 0.33 | ||||
