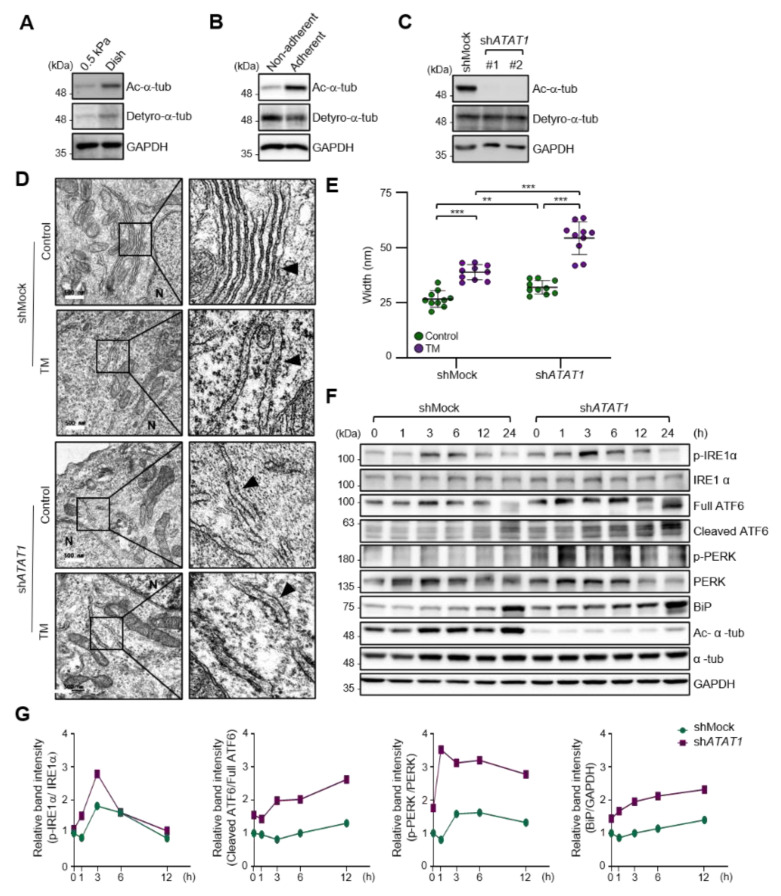
Figure 2.
ECM stiffness-dependent microtubule acetylation regulates ER stress response signaling. (A) Western blot analysis of acetylated and detyrosinated α-tubulin levels in MDA-MB-231 cells cultured on 0.5 kPa PAGs or culture dishes for 48 h. (B) Western blot analysis of acetylated and detyrosinated α-tubulin levels in MDA-MB-231 cells cultured on non-adherent or adherent plates for 48 h. (C) Western blot analysis of ATAT1 KD efficiency in shATAT1 #1- and #2-treated MDA-MB-231 cells compared to shMock-treated cells. (D) Transmission electron microscopy of shMock- and shATAT1 #1-treated MDA-MB-231 cells in the presence or absence of 20 ng/mL tunicamycin (TM) for 24 h. The ER is indicated by arrowheads. Scale bar, 500 nm. (E) Morphometric analysis of ER width in shMock- and shATAT1 #1-treated MDA-MB-231 cells (n = 10). Statistical analysis was performed using one-way ANOVA followed by Tukey multiple comparison tests. One-way ANOVA, F3, 36 = 63.35. ** p < 0.01, *** p < 0.001. (F) Western blot analysis of phospho-IRE1α, IRE1α, ATF6, phospho-PERK, PERK, BiP, acetylated α-tubulin, and α-tubulin in shMock- and shATAT1 #1-treated MDA-MB-231 cells treated with 20 ng/mL TM for the indicated times. GAPDH was analyzed as a loading control in all Western blot assays. (G) Quantification of relative expression in UPR and ER stress marker proteins shown in (F). Band intensities of target proteins were quantified by densitometry using a Quantity One® system. Relative expression of phospho-IRE1α, ATF6, and phospho-PERK were normalized by the band intensities of total IRE1a, full ATF6, and total PERK, respectively. The relative expression of Bip was normalized with GAPDH band intensity. The Western blot images are representative images of the results of at least three independent biological replicates.

