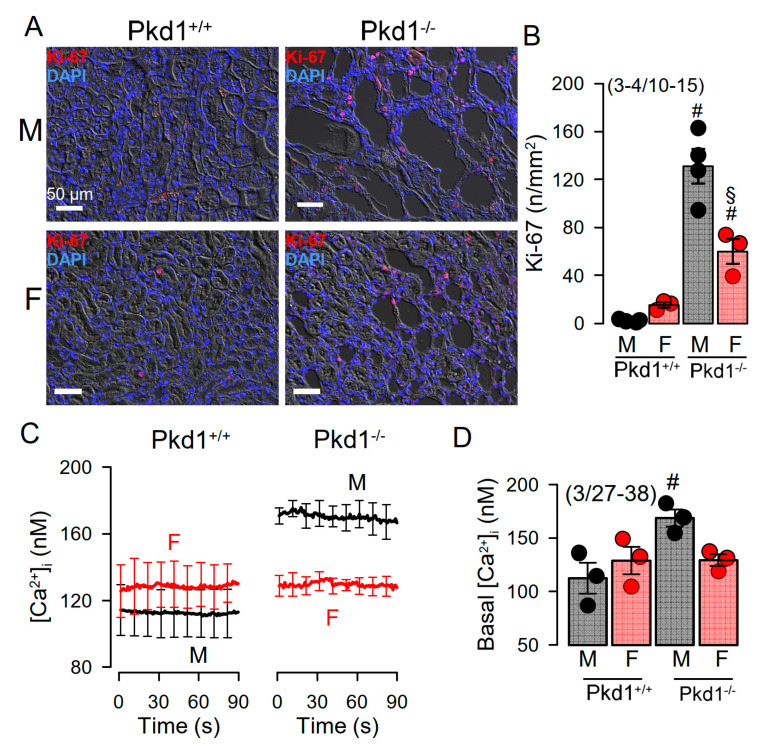
Figure 3.
Cell proliferation and intracellular Ca2+ concentrations in renal epithelial cells from Pkd1+/+ and Pkd1−/− mice. (A) Analysis of tubular epithelial cell proliferation in kidney sections from male and female Pkd1+/+ and Pkd1−/− mice as indicates by Ki-67 staining. Bars = 50 µm. (B) Summary of Ki-67 positive cells/mm2 tissue area in kidneys from male and female Pkd1+/+ and Pkd1−/− mice. Bars = 50 µm. (C,D) Intracellular basal Ca2+ concentrations ([Ca2+]i) as assessed by Fura2 indicates higher basal [Ca2+]iI in male Pkd1−/− mice. Mean ± SEM (number of animals/number of experiments in each series). # Significant difference when compared to Pkd1+/+ (p < 0.05; unpaired t-test). § Significant difference when compared to male (p < 0.05; ANOVA and Tukey’s post-hoc test).

