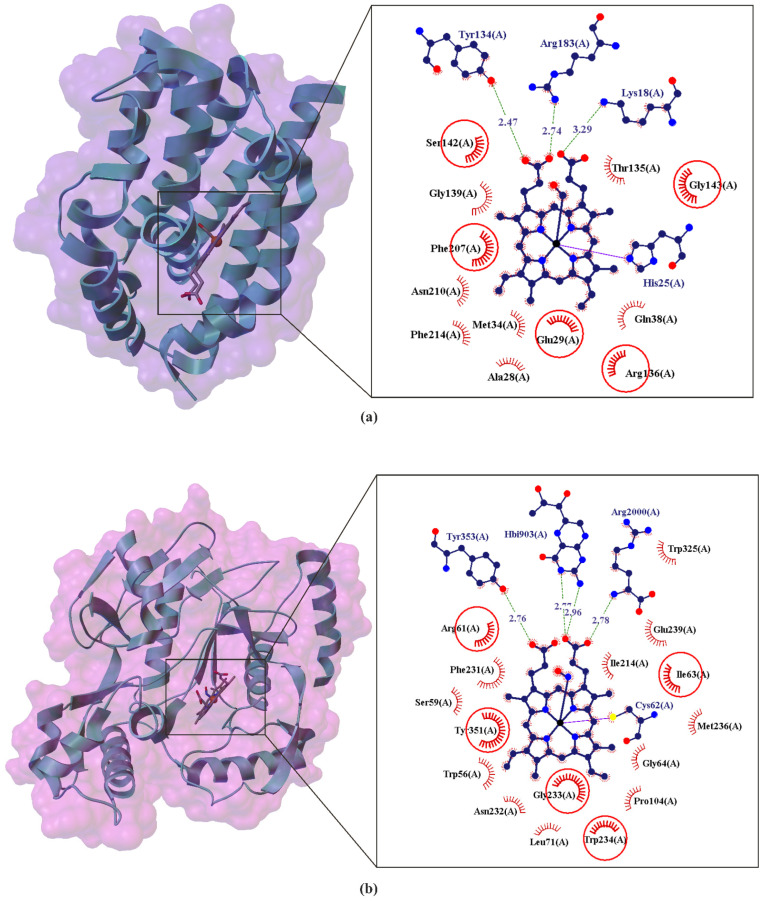
Figure 5.
Comparison of the X-ray structure of Heme Oxygenase-1 (HO-1) binding carbon monoxide (CO) (a) and Nitric oxide synthase (NOS) binding nitric oxide (NO) (b) neurotransmitters in the heme region. The enlarged area shows the structural elements around the CO ligand binding site (PDB ID: 4G98, 2.30 Å) and NO ligand binding site (PDB ID: 2FC1, 2.00 Å) (b). Residues that form hydrogen bonds (dashed lines) with heme are shown in ball-and-stick representation with the interatomic distances shown in Å. Residues forming Van der Waals interactions with heme are shown as labeled arcs with radial spokes that point toward the ligand atoms. The red circles and ellipses identify equivalent residua (in 3D superposition of structures).

