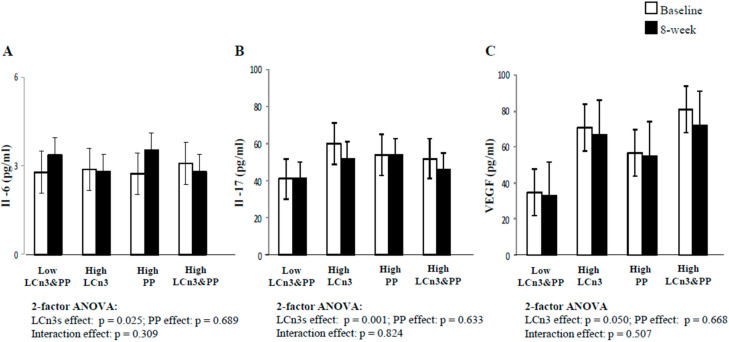
Figure 2.
Fasting serum concentrations of IL-6 (A), IL-17 (B) and VEGF (C) at baseline (white square) and 8-week dietary intervention (black square) in the 4 experimental groups. Mean ± SEM. Comparisons made by 2 factor after ANOVA of percent changes in plasma hs-CRP adjusted for sex, age, and baseline BMI.LCn3, long-chain n-3 fatty acids; PP, polyphenols. For IL-6 (A): n = 12 for Control, n = 13 for High LCn3, n = 11 for High PP, n = 13 for High LCn3&PP group.

