Figure 2.
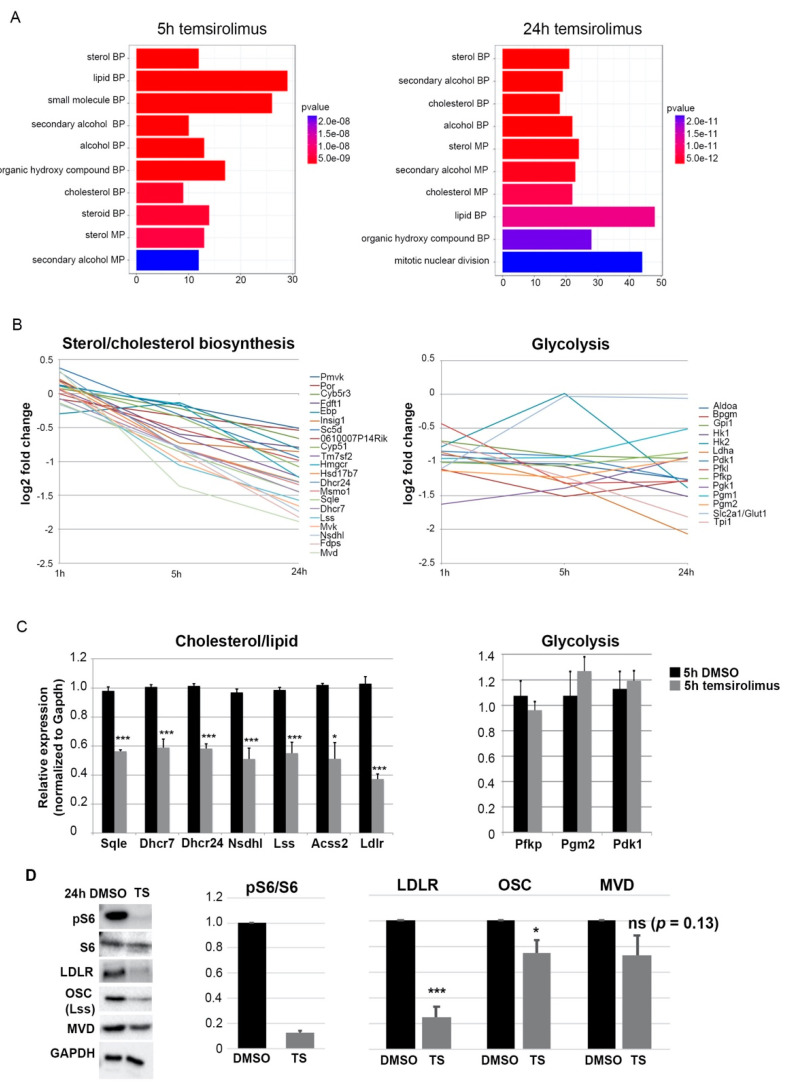
Temsirolimus treatment causes downregulation of genes of the sterol/cholesterol biosynthesis pathway. (A) Barplots of the top 10 GO enriched terms of downregulated genes after 5 h (left) and 24 h (right) of temsirolimus treatment. Both plots show a high enrichment for metabolic pathways shown on the y-axis and the number of gene counts on the x-axis. Enrichment scores are depicted in the colored bar. (B) Inhibition of mTORC1 by temsirolimus treatment downregulates the sterol and cholesterol biosynthesis pathway genes but does not change expression of glycolysis genes. (C) Confirmation of changes in the expression of cholesterol/glycolysis genes by RT-qPCR. Cells were lysed after 5 h of temsirolimus/DMSO treatment and subjected to total RNA extraction and RT-qPCR; mRNA expression was normalized to the housekeeping gene GAPDH (D) Western blot experiments in primary neurons after treatment with DMSO or temsirolimus for 24 h. Reduction in pS6 in relation to S6 confirms mTORC1 inhibition. Expression pattern of proteins involved in cholesterol biosynthesis. Data represent the average of three biological replicates (from three independent donor litters). For statistical analyses, Student’s t-test was used. * p < 0.05; *** p < 0.001.

